Question: Can you help me? Using data from the both companies , compare their performances. In your analysis, explain which company you would prefer doing business
Can you help me?
Using data from theboth companies, compare their performances. In your analysis, explain which company you would prefer doing business from the perspective of the following parties:
- An investor; and
- An inventory supplier.
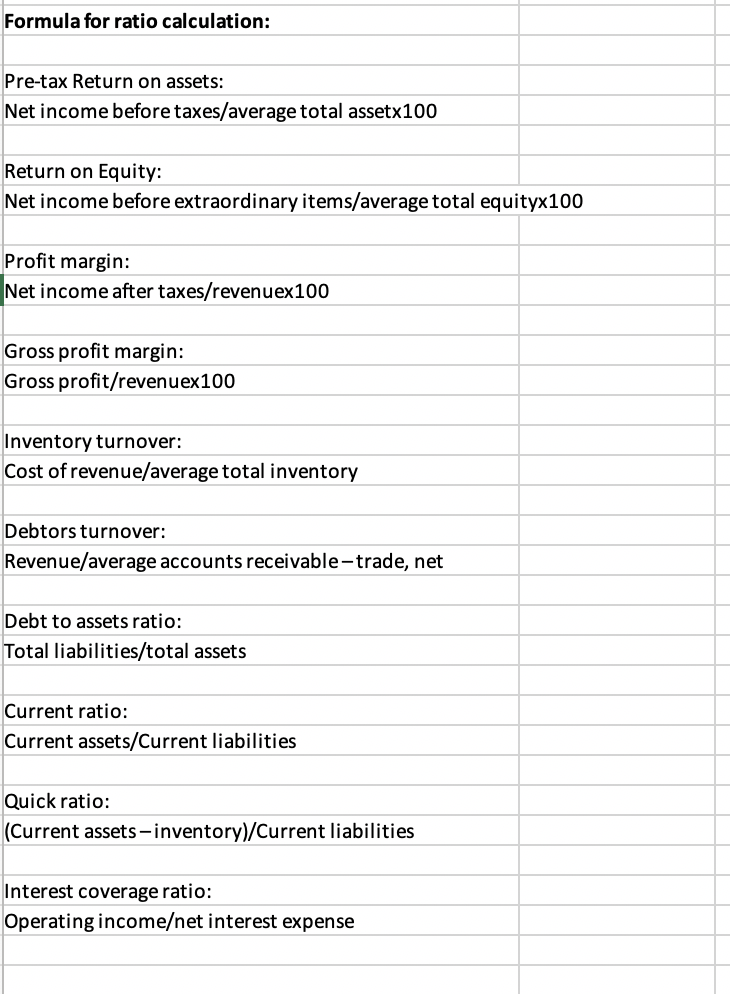
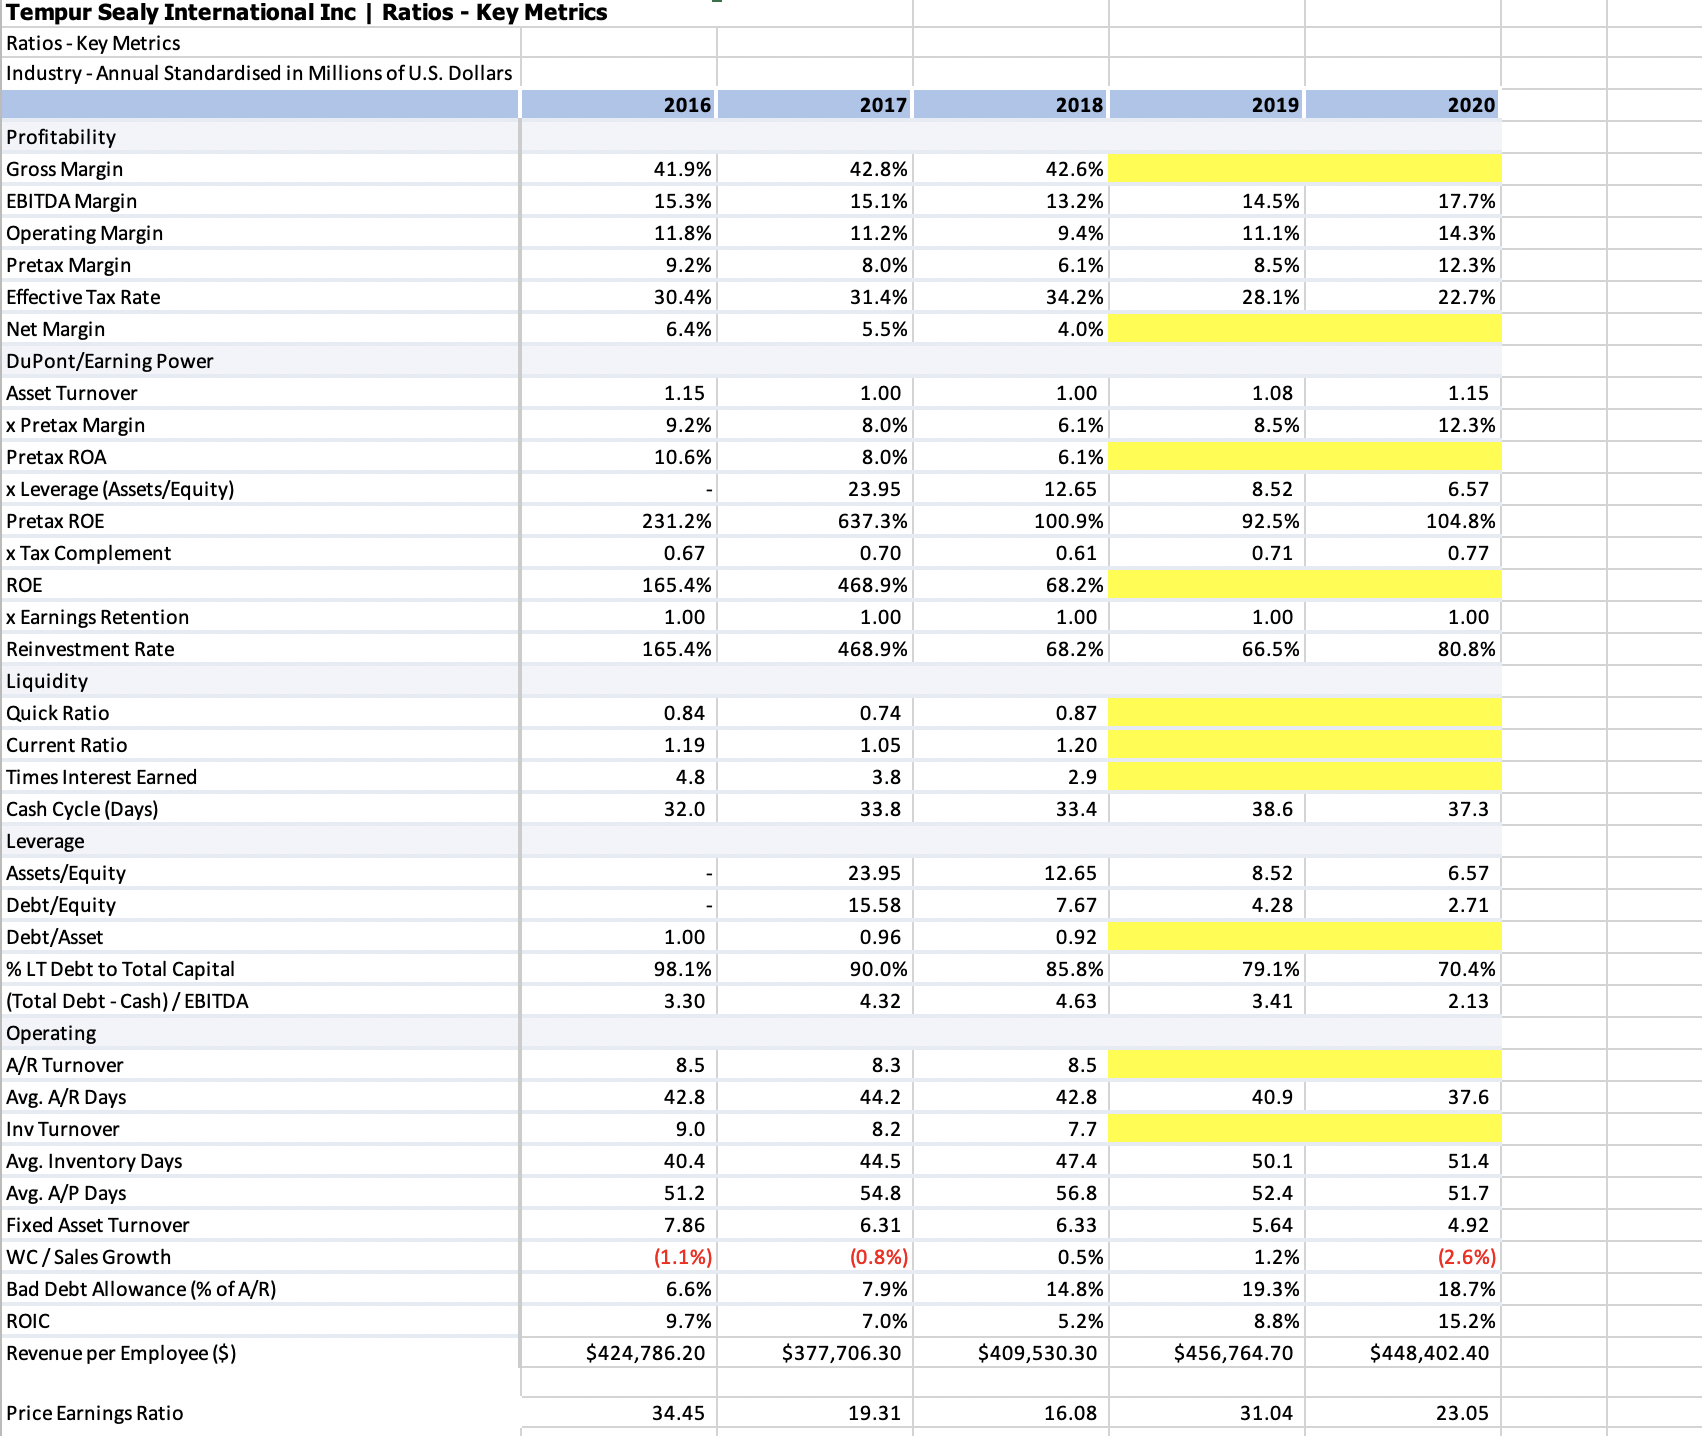
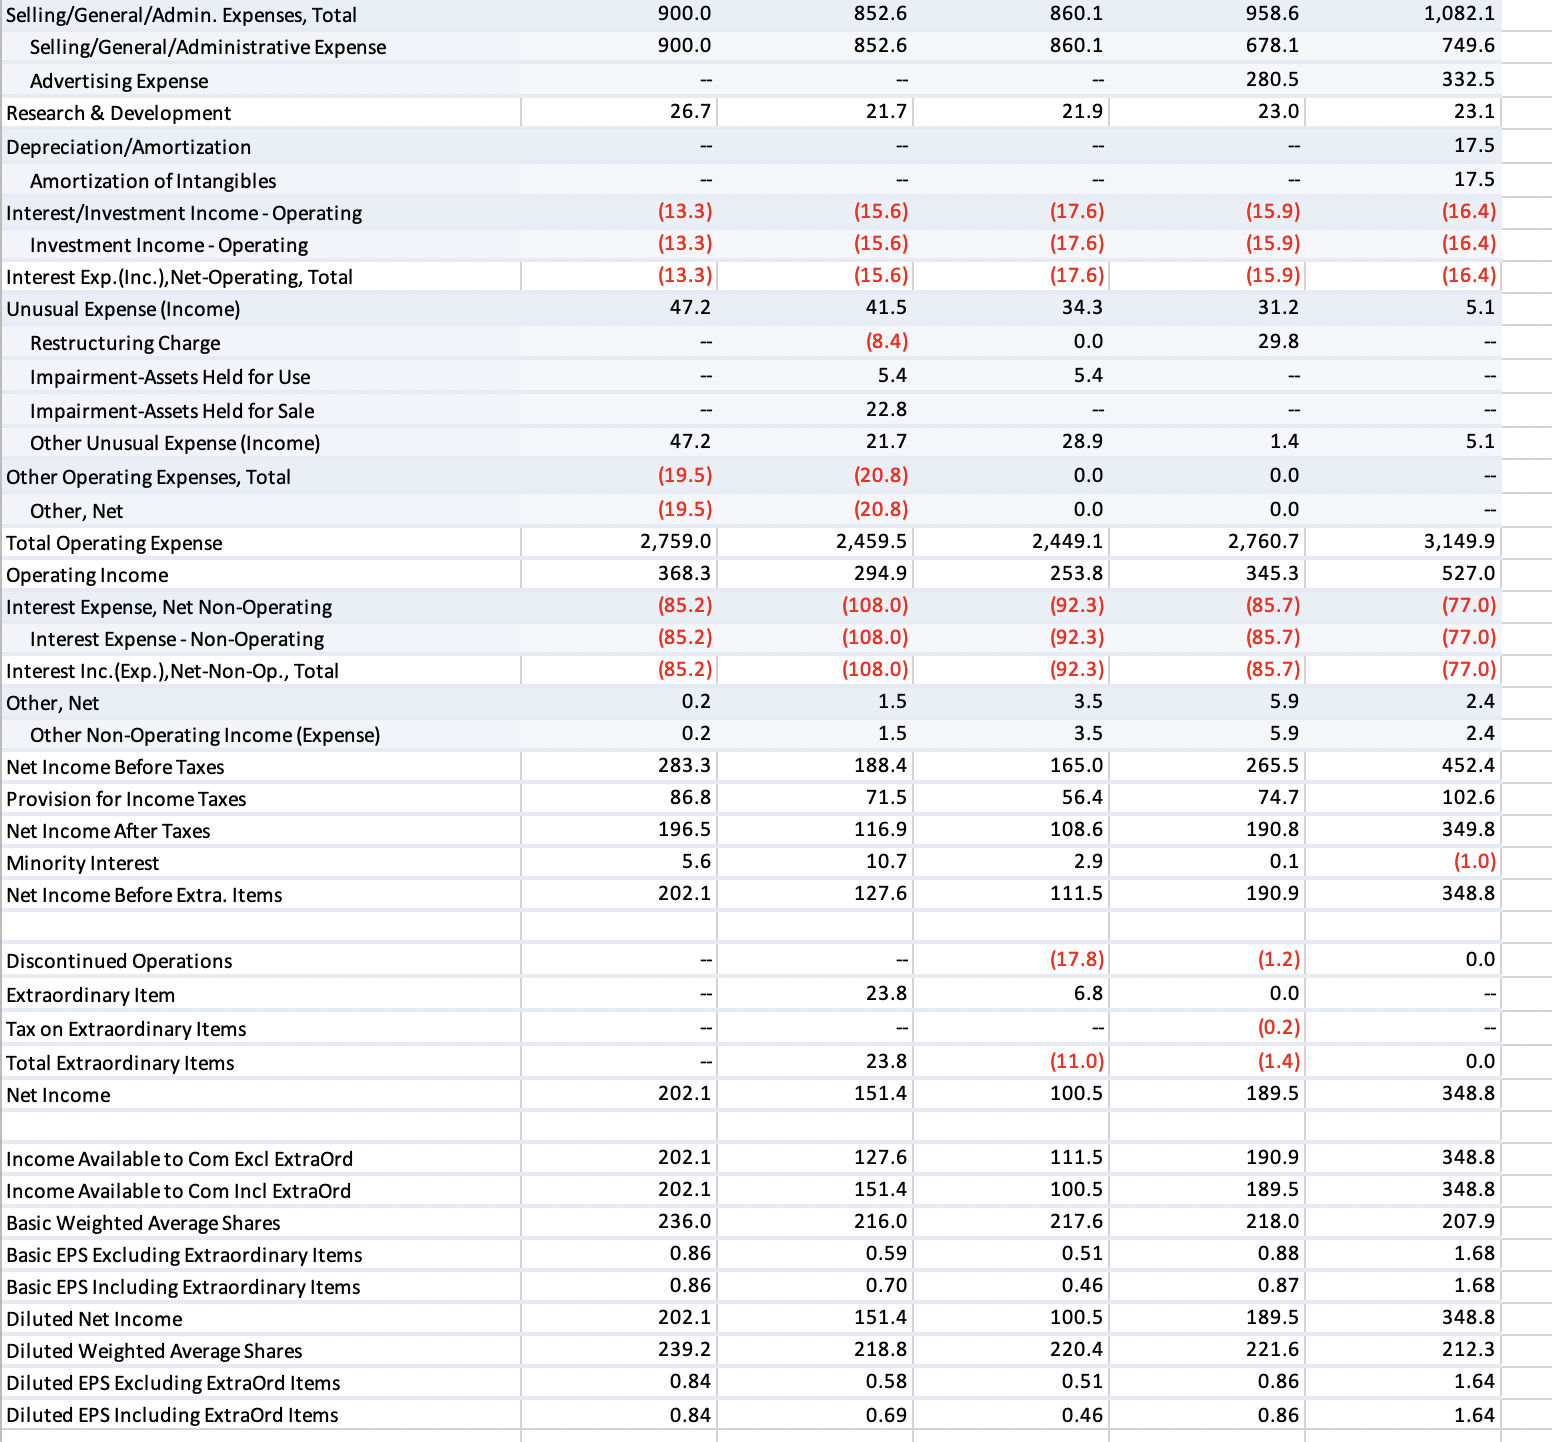
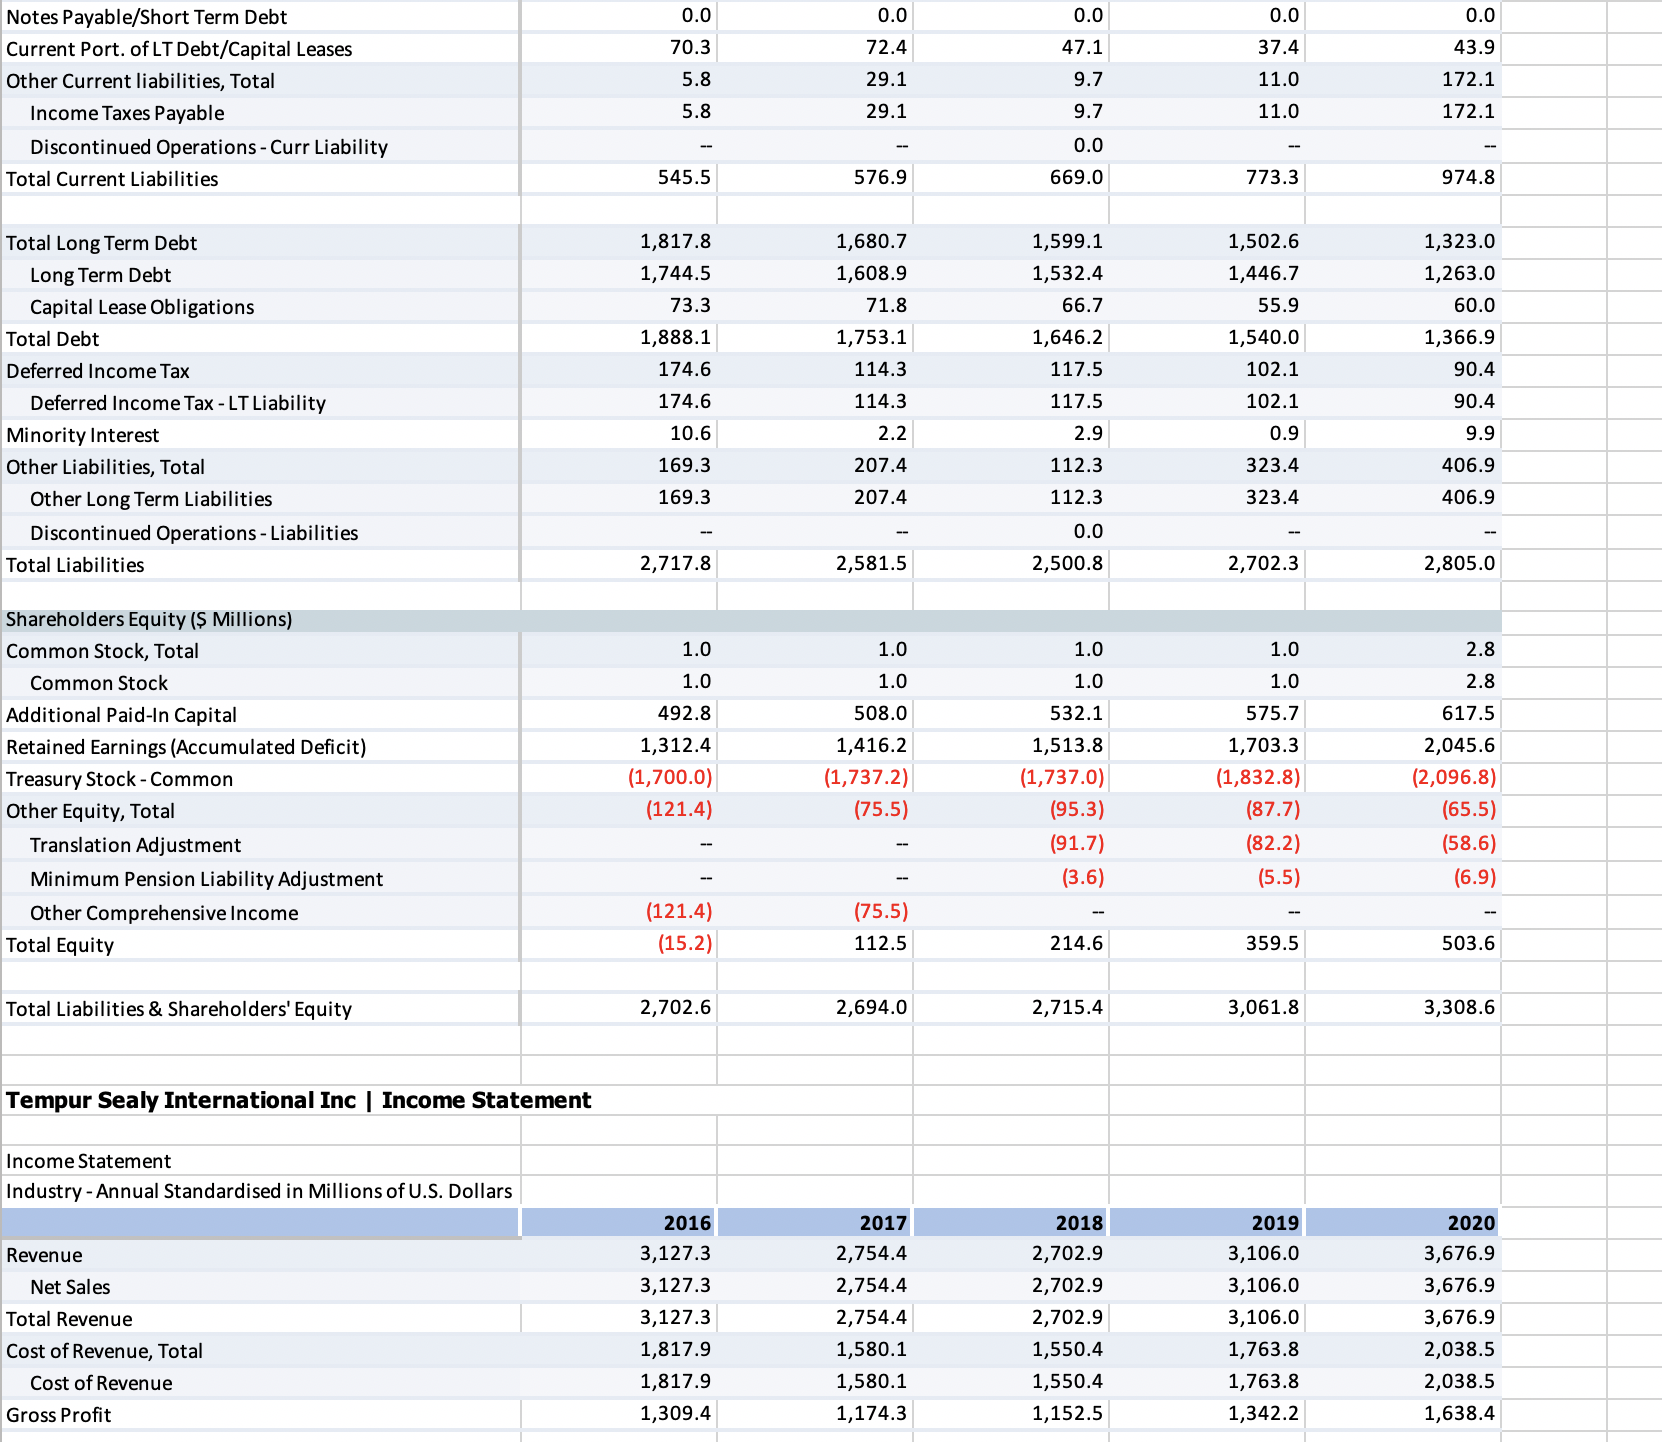
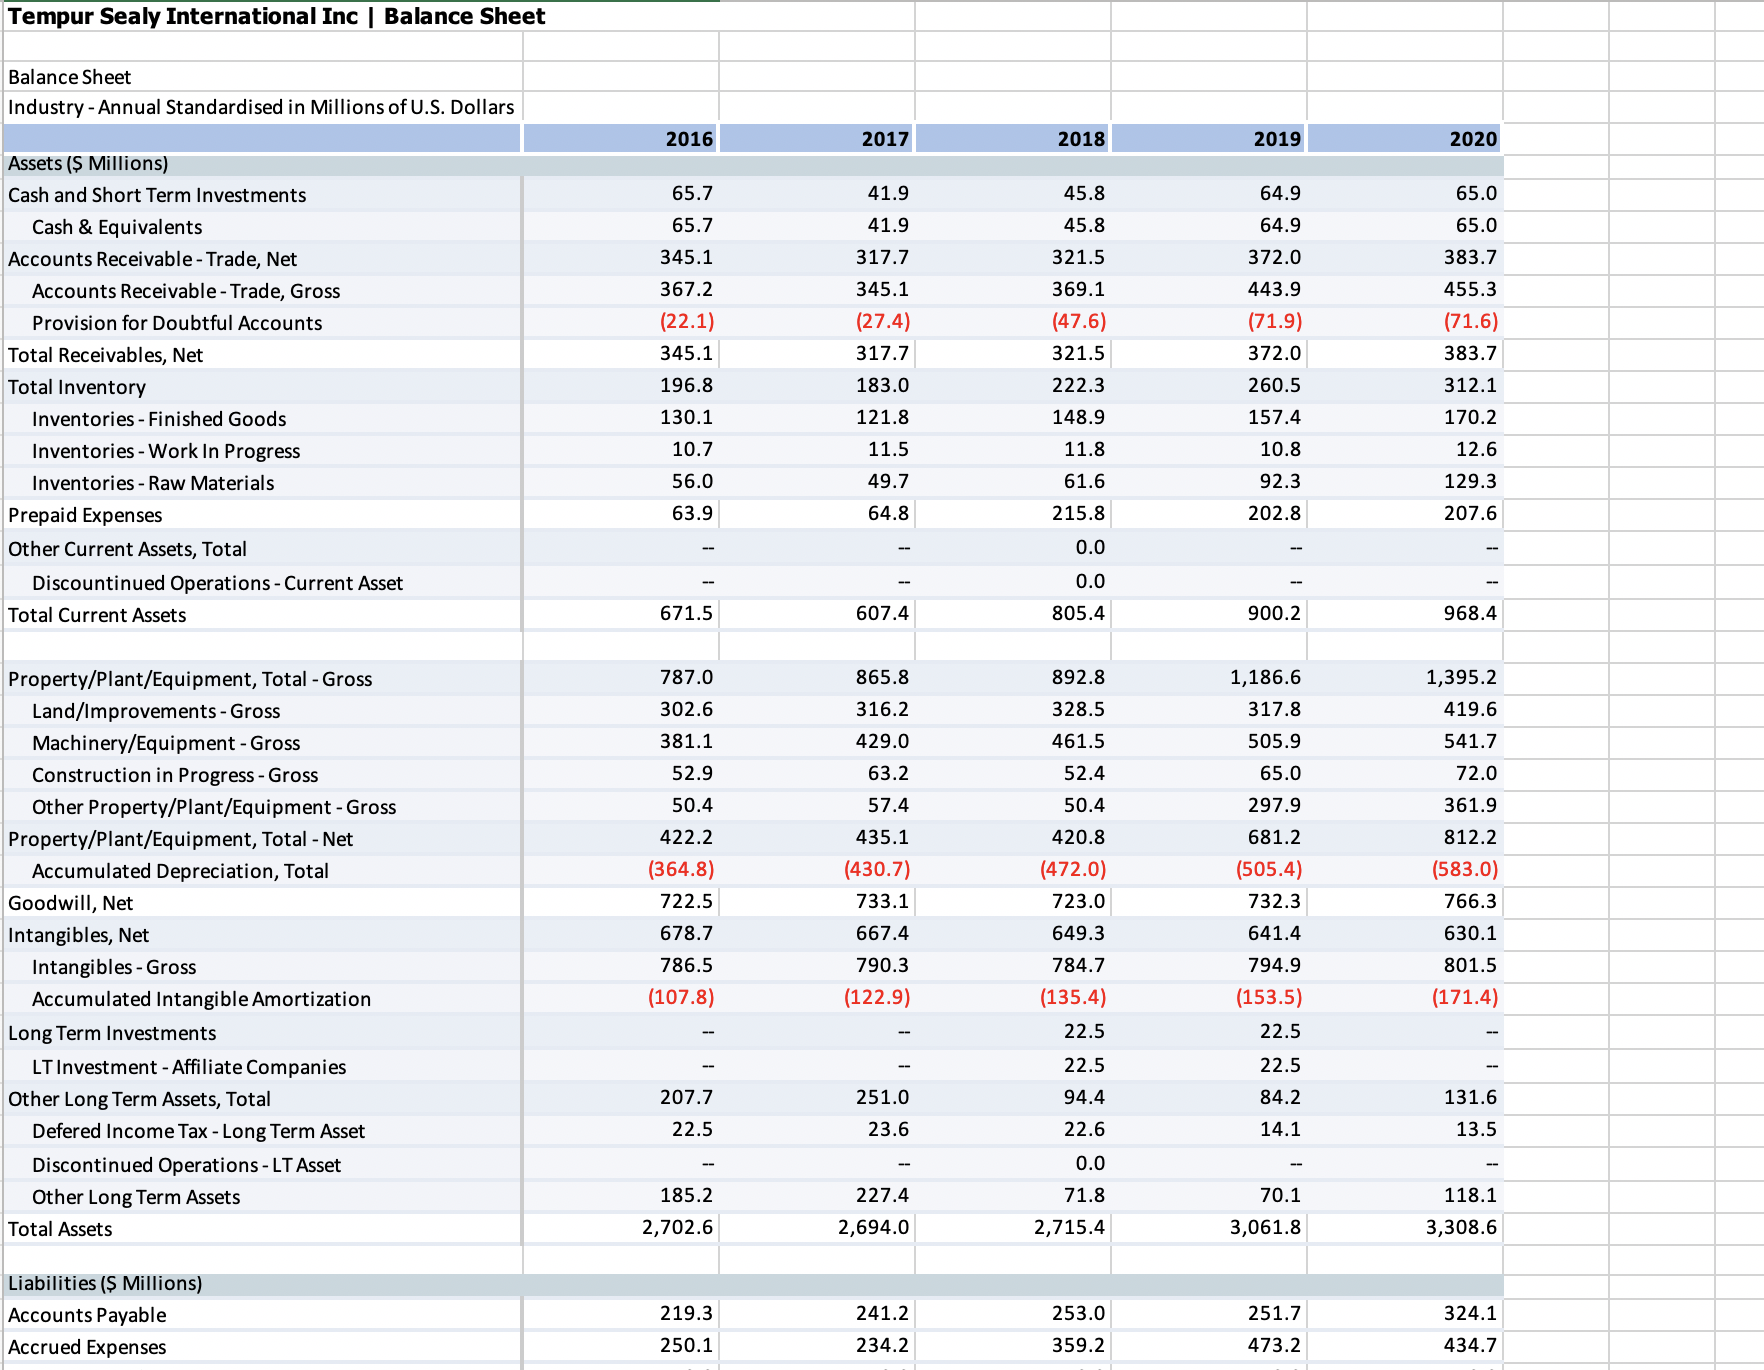
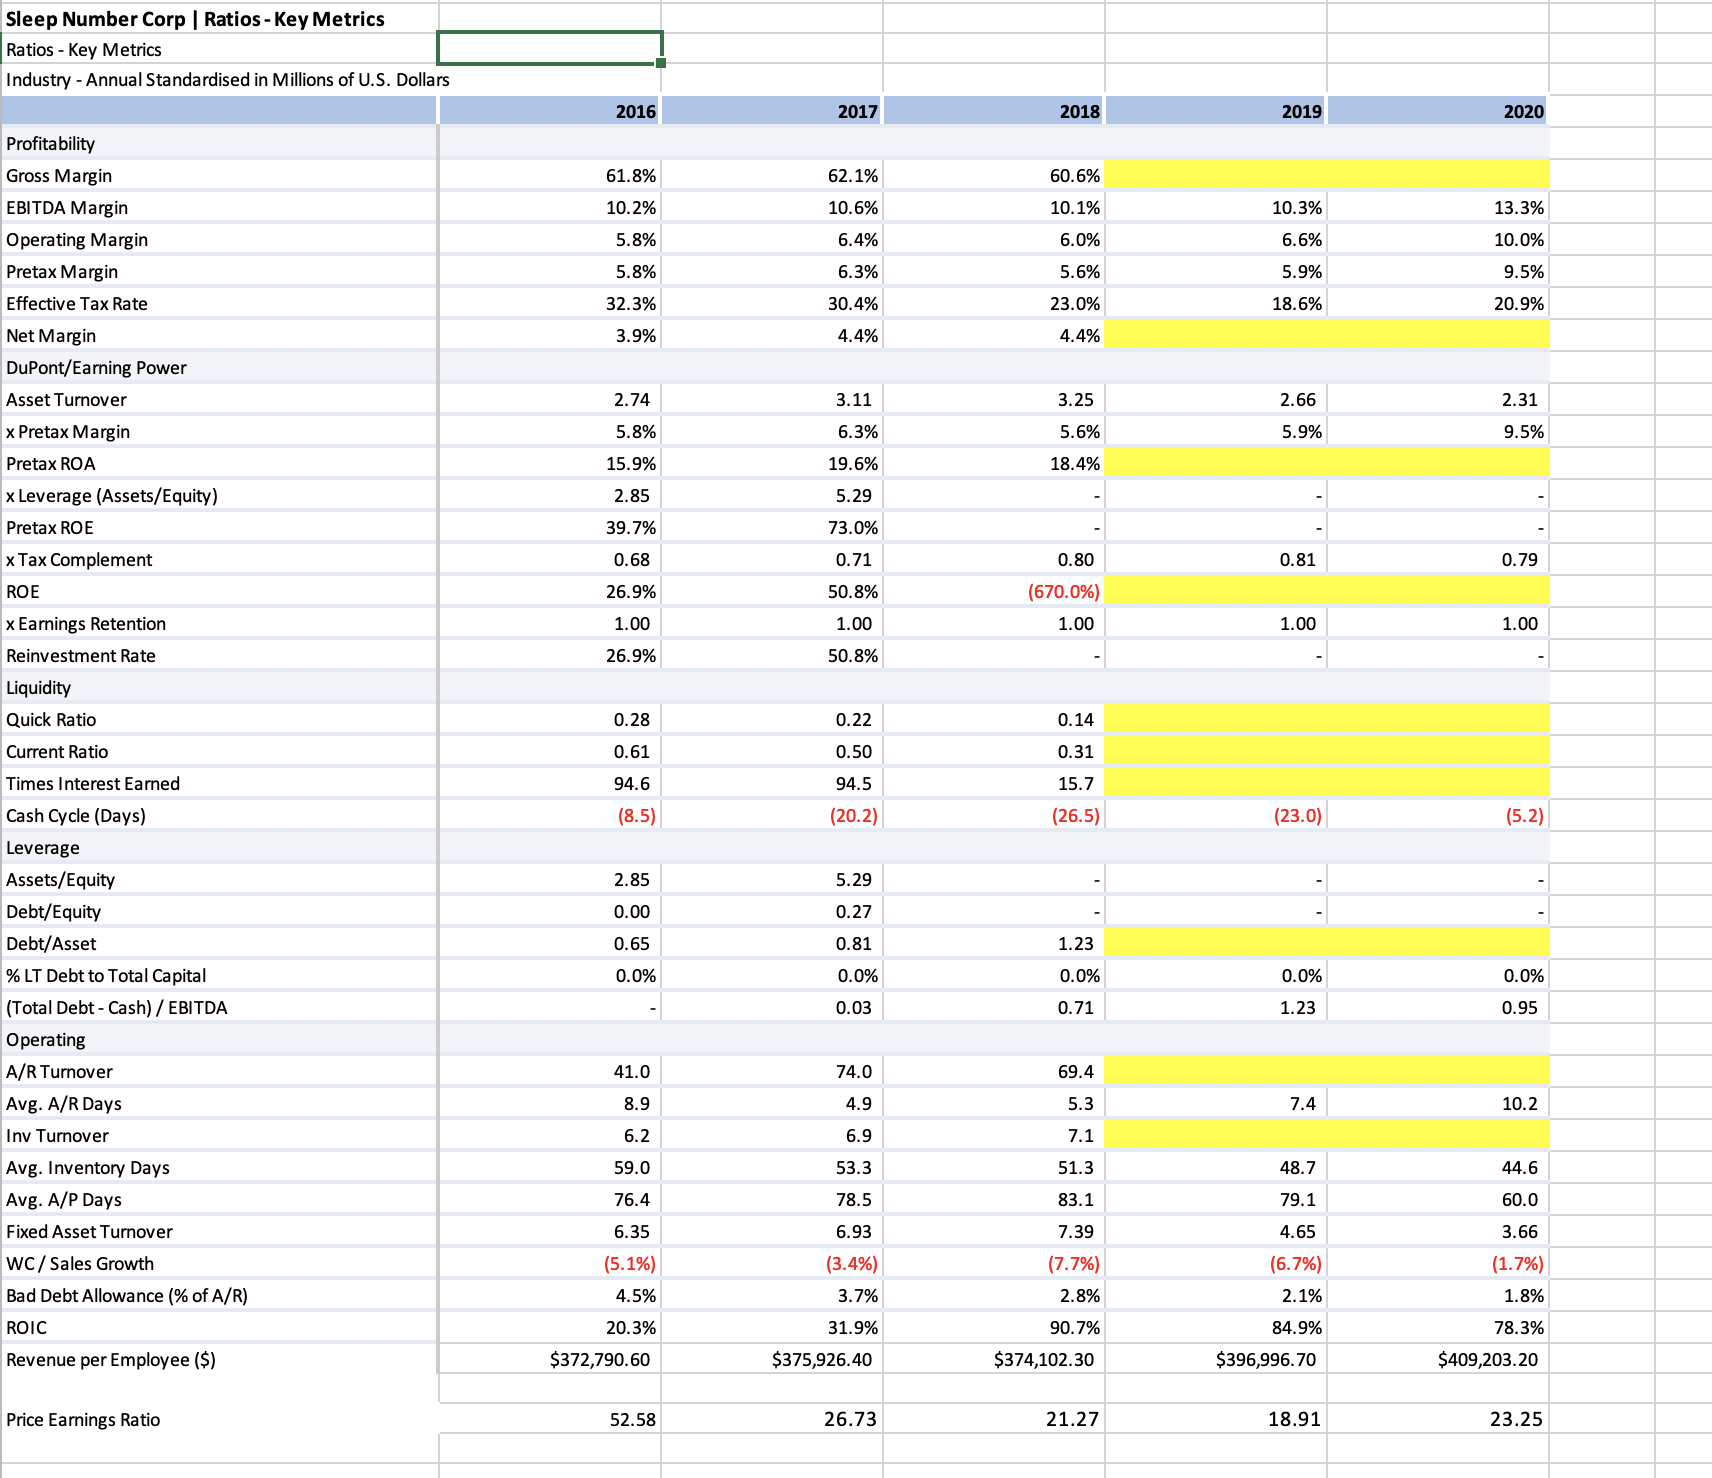
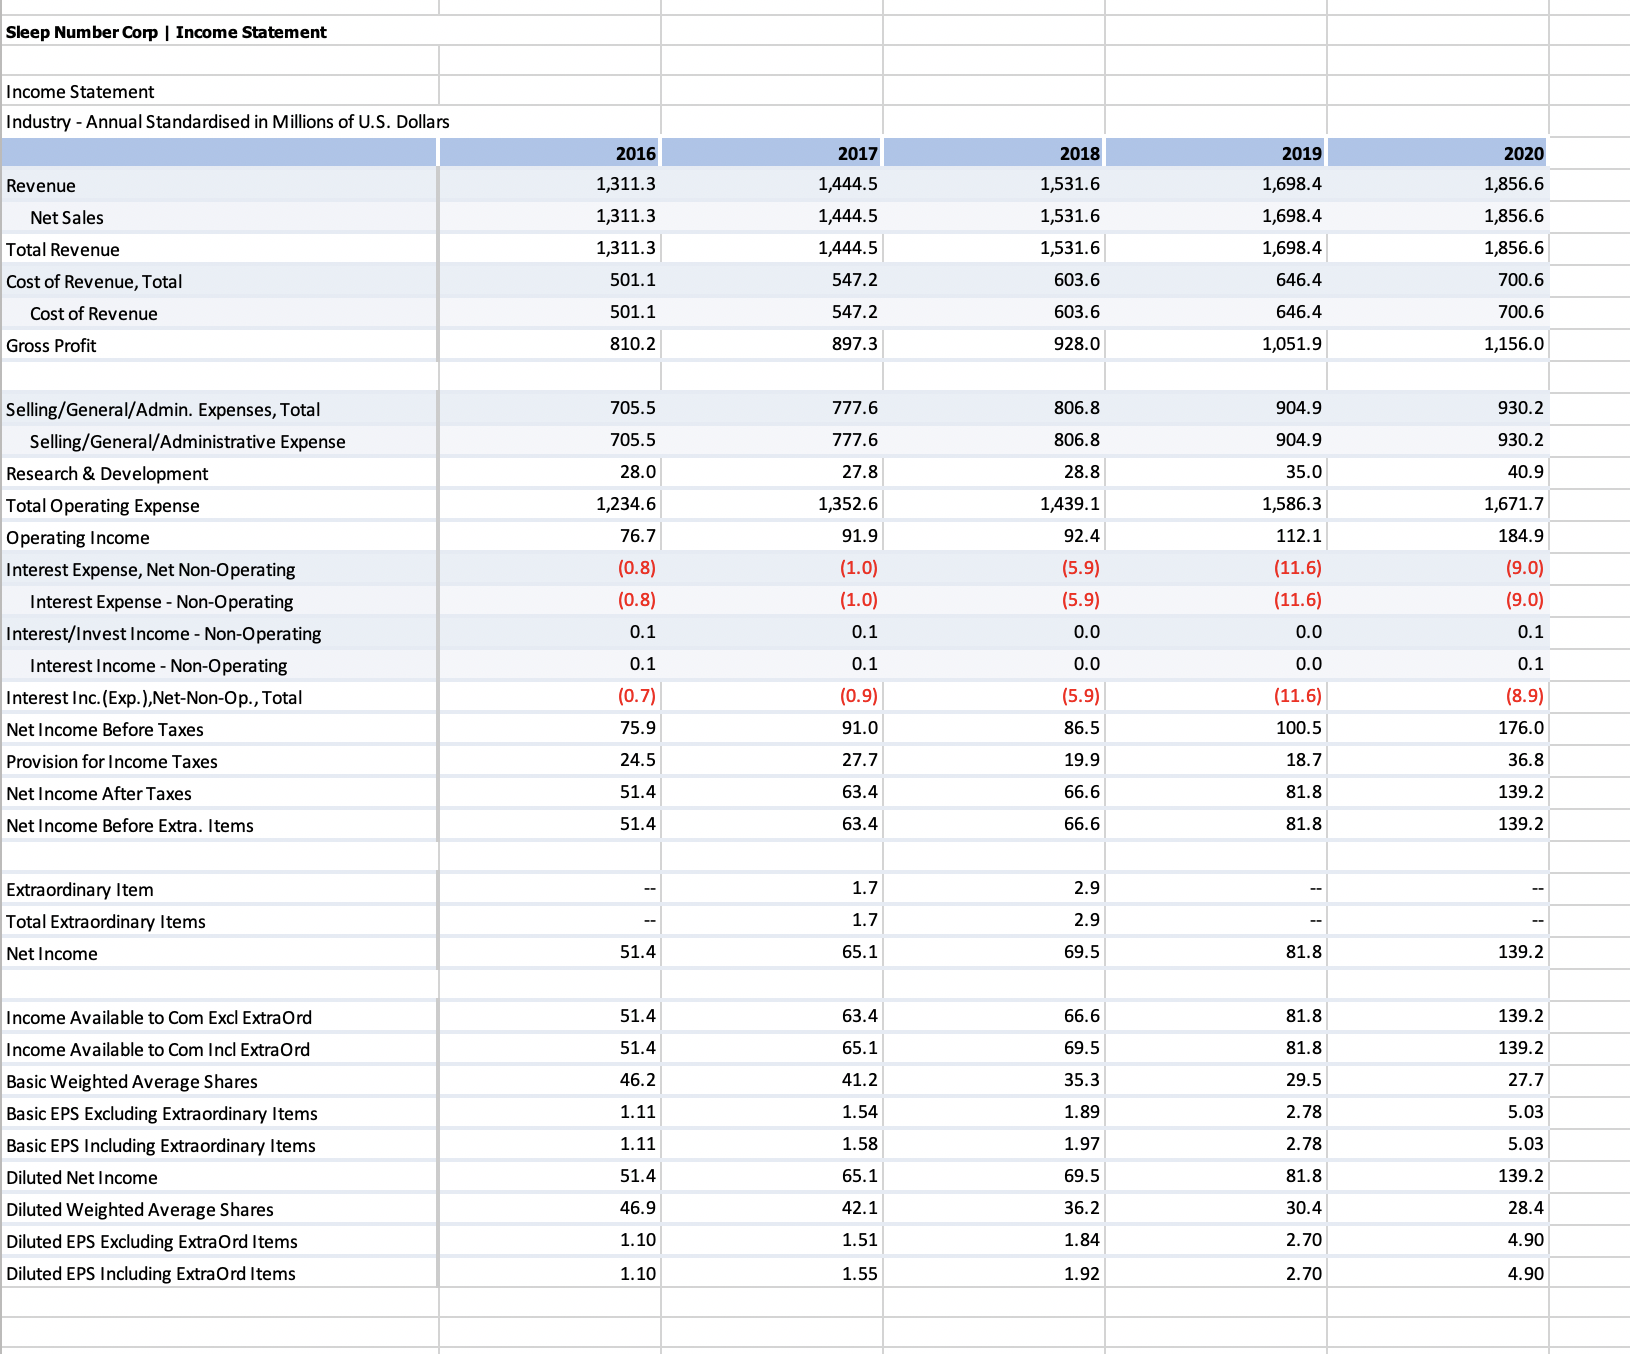
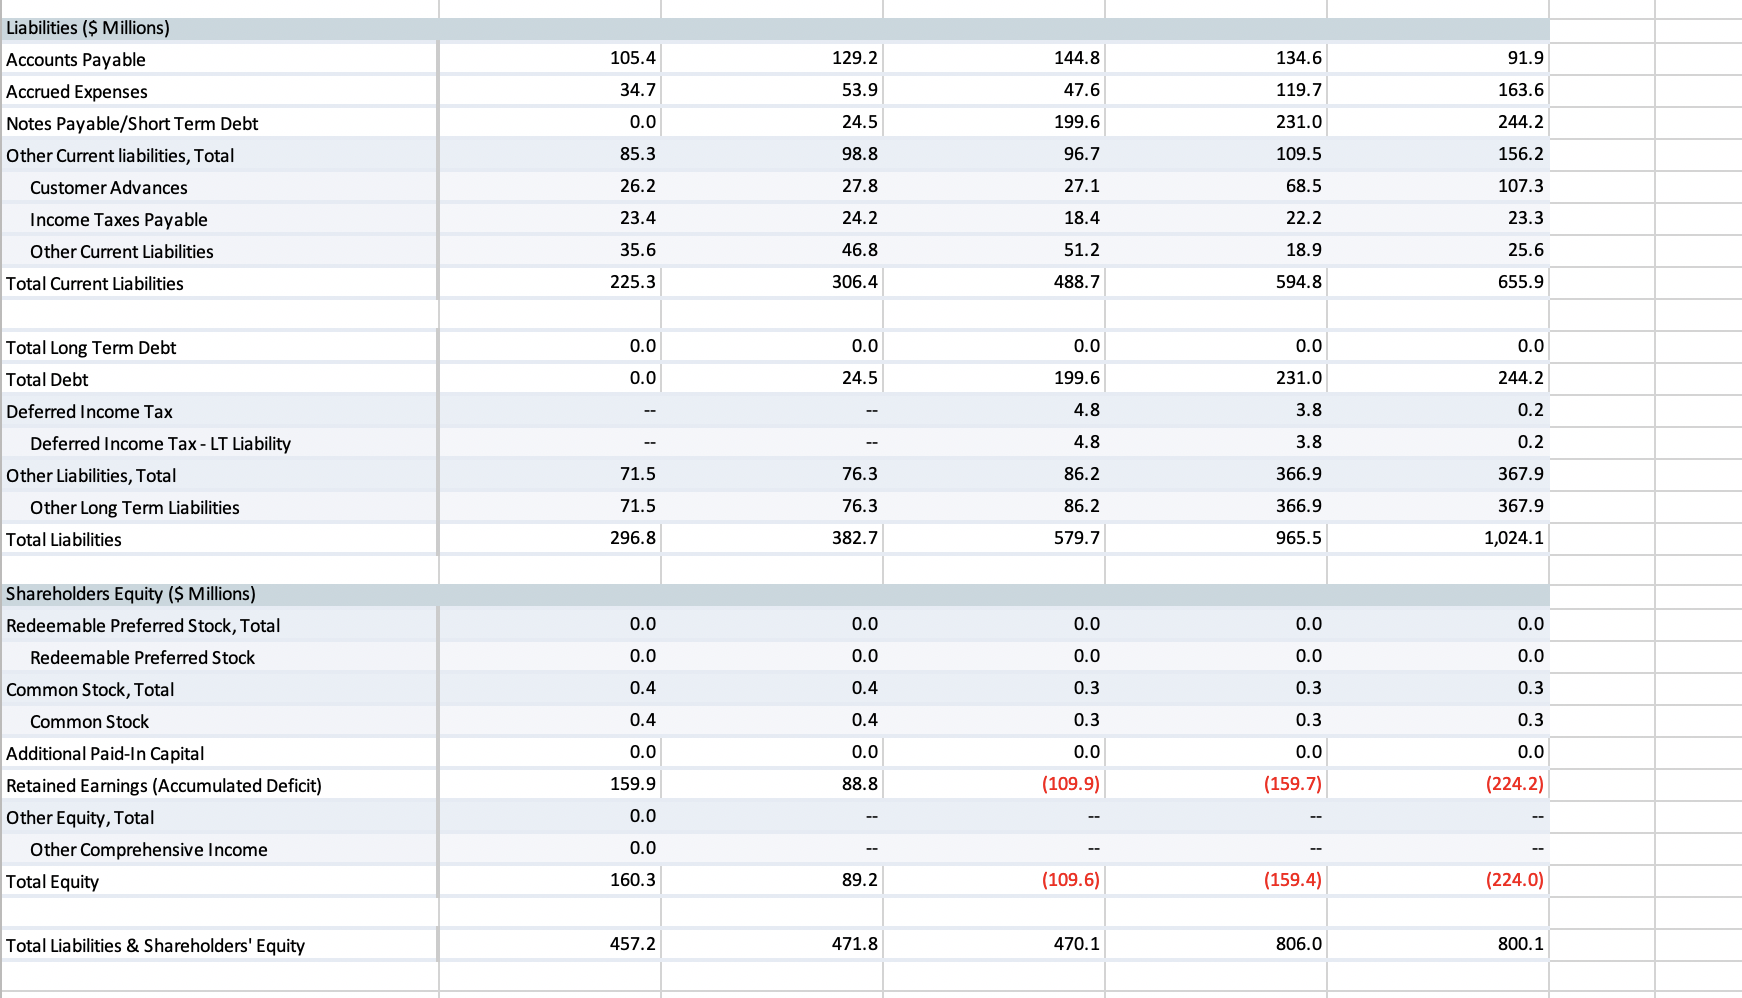
Formula for ratio calculation: Pre-tax Return on assets: Net income before taxes/average total assetx100 Return on Equity: Net income before extraordinary items/average total equityx100 Profit margin: Net income after taxes/revenuex100 Gross profit margin: Gross profit/revenuex100 Inventory turnover: Cost of revenue/average total inventory Debtors turnover: Revenue/average accounts receivable -trade, net Debt to assets ratio: Total liabilities/total assets Current ratio: Current assets/Current liabilities Quick ratio: (Current assets-inventory)/Current liabilities Interest coverage ratio: Operating incomeet interest expenseTempur Sealy International Inc | Ratios - Key Metrics Ratios - Key Metrics Industry - Annual Standardised in Millions of U.S. Dollars 2016 2017 2018 2019 2020 Profitability 41.9% 42.8% 42.6% Gross Margin EBITDA Margin 15.3% 15.1% 13.2% 14.5% 17.7% 9.4% 11.1% 14.3% Operating Margin 11.8% 11.2% Pretax Margin 9.2% 8.0% 6.1% 8.5% 12.3% 28.1% 22.7% Effective Tax Rate 30.4% 31.4% 34.2% 6.4% 5.5% 4.0% Net Margin DuPont/Earning Power Asset Turnover 1.15 1.00 1.00 1.08 1.15 x Pretax Margin 9.2% 3.0% 6.1% 8.5% 12.3% 6.1% Pretax ROA 10.6% 8.0% x Leverage (Assets/Equity) 23.95 12.65 8.52 6.57 231.2% 637.3% 100.9% 92.5% 104.8% Pretax ROE 0.67 0.70 0.61 ),71 0.77 x Tax Complement 165.4% 468.9% 68.2% ROE 1.00 1.00 1.00 1.00 1.00 x Earnings Retention 165.4% 468.9% 68.2% 66.5% 80.8% Reinvestment Rate Liquidity Quick Ratio 0.84 0.74 0.87 Current Ratio 1.19 1.05 1.20 Times Interest Earned 4.8 3.8 2.9 33.4 38.6 $7.3 Cash Cycle (Days) 32.0 33.8 Leverage 12.65 8.52 6.57 Assets/Equity 23.95 7.67 4.28 2.71 Debt/Equity 15.58 Debt/Asset 1.00 0.96 0.92 90.0% 85.8% 79.1% 70.4% % LT Debt to Total Capital 98.1% (Total Debt - Cash) / EBITDA 3.30 4.32 4.63 3.41 2.13 Operating 8.5 8.3 8.5 A/R Turnover Avg. A/R Days 42.8 44.2 42.8 40.9 37.6 8.2 7.7 Inv Turnover 9.0 40.4 44.5 47.4 50.1 51.4 Avg. Inventory Days 51.2 54.8 56.8 52.4 51.7 Avg. A/P Days Fixed Asset Turnover 7.86 6.31 6.33 5.64 4.92 0.5% WC / Sales Growth (1.1% (0.8%) 1.2% 2.6% Bad Debt Allowance (% of A/R) 6.6% 7.9% 14.8% 19.3% 18.7% ROIC 9.7% 7.0% 5.2% 8.8% 15.2% $456,764.70 $448,402.40 Revenue per Employee ($) $424,786.20 $377,706.30 $409,530.30 16.08 Price Earnings Ratio 34.45 19.31 31.04 23.05Selling/General/Admin. Expenses, Total 900.0 852.6 860.1 958.6 1,082.1 Selling/General/Administrative Expense 900.0 852.6 860.1 678.1 749.6 Advertising Expense 280.5 332.5 Research & Development 26.7 21.7 21.9 23.0 23.1 Depreciation/Amortization 17.5 Amortization of Intangibles 17.5 Interest/Investment Income - Operating (13.3) (15.6) 17.6) 15.9 (16.4) Investment Income - Operating (13.3) (15.6) 17.6) (15.9) (16.4) Interest Exp.(Inc.), Net-Operating, Total (13.3) (15.6) (17.6) (15.9) (16.4) Unusual Expense (Income 47.2 41.5 34.3 31.2 5.1 Restructuring Charge (8.4) 0.0 29.8 Impairment-Assets Held for Use 5.4 5.4 Impairment-Assets Held for Sale 22.8 Other Unusual Expense (Income) 47.2 21.7 28.9 1.4 5.1 Other Operating Expenses, Total (19.5) (20.8) 0.0 0.0 Other, Net (19.5) (20.8 0.0 0.0 Total Operating Expense 2,759.0 2,459.5 2,449.1 2,760.7 3,149.9 Operating Income 368.3 294.9 253.8 345.3 527.0 Interest Expense, Net Non-Operating (85.2 (108.0) 92.3) (85.7) 77.0) Interest Expense - Non-Operating 85.2) (108.0) 92.3) 85.7) 77.0) Interest Inc. (Exp.), Net-Non-Op., Total (85.2 (108.0) (92.3 ) (85.7) (77.0 Other, Net 0.2 1.5 3.5 5.9 2.4 Other Non-Operating Income (Expense) 0.2 1.5 3.5 5.9 2.4 Net Income Before Taxes 283.3 188.4 165.0 265.5 452.4 Provision for Income Taxes 86.8 1.5 56.4 74.7 102.6 Net Income After Taxes 196.5 116.9 108.6 190.8 349.8 Minority Interest 5.6 10.7 2.9 0.1 (1.0) Net Income Before Extra. Items 202.1 127.6 111.5 190.9 348.8 Discontinued Operations (17.8) (1.2) 0.0 Extraordinary Item 23.8 6.8 0.0 Tax on Extraordinary Items (0.2) Total Extraordinary Items 23.8 (11.0) (1.4) 0.0 Net Income 202.1 151.4 100.5 189. 348.8 Income Available to Com Excl ExtraOrd 202.1 127.6 111.5 190.9 348.8 Income Available to Com Incl ExtraOrd 202.1 151.4 100.5 189.5 348.8 Basic Weighted Average Shares 236.0 216.0 217.6 218.0 207.9 Basic EPS Excluding Extraordinary Items 0.86 0.59 0.51 0.88 1.68 Basic EPS Including Extraordinary Items 0.86 0.70 0.46 0.87 1.68 Diluted Net Income 202.1 151.4 100.5 189.5 348.8 Diluted Weighted Average Shares 239.2 218.8 220.4 221.6 212.3 Diluted EPS Excluding ExtraOrd Items 0.84 0.58 0.51 0.86 1.64 Diluted EPS Including ExtraOrd Items 0.84 0.69 0.46 0.86 1.64Notes Payable/Short Term Debt 0.0 0.0 0.0 0.0 0.0 Current Port. of LT Debt/Capital Leases 70.3 72.4 47.1 37.4 43.9 Other Current liabilities, Total 5.8 29.1 9.7 11.0 172.1 Income Taxes Payable 5.8 29.1 9.7 11.0 172.1 Discontinued Operations - Curr Liability 0.0 Total Current Liabilities 545.5 576.9 669.0 773.3 974.8 Total Long Term Debt 1,817.8 1,680.7 1,599.1 1,502.6 1,323.0 Long Term Debt 1,744.5 1,608.9 1,532.4 1,446.7 1,263.0 Capital Lease Obligations 73.3 71.8 66.7 55.9 60.0 Total Debt 1,888.1 1,753.1 1,646.2 1,540.0 1,366.9 Deferred Income Tax 174.6 114.3 117.5 102.1 90.4 Deferred Income Tax - LT Liability 174.6 114.3 117.5 102.1 90.4 Minority Interest 10.6 2.2 2.9 0.9 9.9 Other Liabilities, Total 169.3 207.4 112.3 323.4 406.9 Other Long Term Liabilities 169.3 207.4 112.3 323.4 406.9 Discontinued Operations - Liabilities 0.0 Total Liabilities 2,717.8 2,581.5 2,500.8 2,702.3 2,805.0 Shareholders Equity ($ Millions) Common Stock, Total 1.0 1.0 1.0 1.0 2.8 Common Stock 1.0 1.0 1.0 1.0 2.8 Additional Paid-In Capital 492.8 508.0 532.1 575.7 617.5 Retained Earnings (Accumulated Deficit) 1,312.4 1,416.2 1,513.8 1,703.3 2,045.6 Treasury Stock - Common (1, 700.0) (1, 737.2) (1,737.0) (1,832.8) (2,096.8) Other Equity, Total (121.4) (75.5) 95.3) (87.7) (65.5) Translation Adjustment (91.7) (82.2) (58.6 Minimum Pension Liability Adjustment (3.6) (5.5) (6.9) Other Comprehensive Income (121.4) (75.5) Total Equity (15.2) 112.5 214.6 359.5 503.6 Total Liabilities & Shareholders' Equity 2,702.6 2,694.0 2,715.4 3,061.8 3,308.6 Tempur Sealy International Inc | Income Statement Income Statement Industry - Annual Standardised in Millions of U.S. Dollars 2016 2017 2018 2019 2020 Revenue 3,127.3 2,754.4 2,702.9 3,106.0 3,676.9 Net Sales 3, 127.3 2,754.4 2,702.9 3,106.0 3,676.9 Total Revenue 3,127.3 2,754.4 2, 702.9 3,106.0 3,676.9 Cost of Revenue, Total 1,817.9 1,580.1 1,550.4 1,763.8 2,038.5 Cost of Revenue 1,817.9 1,580.1 1,550.4 1,763.8 2,038.5 Gross Profit 1,309.4 1,174.3 1,152.5 1,342.2 1,638.4Tempur Sealy International Inc | Balance Sheet Balance Sheet Industry - Annual Standardised in Millions of U.S. Dollars 2016 2017 2018 2019 2020 Assets ($ Millions) Cash and Short Term Investments 65.7 41.9 45.8 64.9 65.0 Cash & Equivalents 65.7 41.9 45.8 64.9 65.0 Accounts Receivable - Trade, Net 345.1 317.7 321.5 372.0 383.7 Accounts Receivable - Trade, Gross 367.2 345.1 369.1 443.9 455.3 Provision for Doubtful Accounts (22.1) (27.4 47.6) (71.9) (71.6 Total Receivables, Net 345.1 317.7 321.5 372.0 383.7 196.8 183.0 222.3 260.5 312.1 Total Inventory shed Goo 130.1 121.8 148.9 157.4 170.2 Inventories - Work In Progress 10.7 11.5 11.8 10.8 12.6 56.0 49.7 61.6 92.3 129.3 Inventories - Raw Materials 63.9 64.8 215.8 202.8 207.6 Prepaid Expenses Other Current Assets, Total 0.0 Discountinued Operations - Current Asset 0.0 805.4 Total Current Assets 671.5 607.4 900.2 968.4 Property/Plant/Equipment, Total - Gross 787.0 865.8 892.8 1,186.6 1,395.2 Land/Improvements - Gross 302.6 316.2 328.5 317.8 419.6 Machinery/Equipment - Gross 381.1 429.0 461.5 505.9 541.7 52.9 52.4 5.0 72.0 Construction in Progress - Gross 63.2 Other Property/Plant/Equipment - Gross 50.4 57.4 50.4 297.9 361.9 Property/Plant/Equipment, Total - Net 422.2 435.1 420.8 681.2 812.2 Accumulated Depreciation, Total (364.8) (430.7) (472.0) (505.4) (583.0) Goodwill, Net 722.5 733.1 723.0 732.3 766.3 Intangibles, Net 678.7 667.4 649.3 641.4 630.1 786.5 790.3 784.7 794.9 801.5 Intangibles - Gross Accumulated Intangible Amortization (107.8) (122.9) (135.4) (153.5) (171.4) Long Term Investments 22.5 22.5 LT Investment - Affiliate Companies 22.5 22.5 Other Long Term Assets, Total 207.7 251.0 94.4 84.2 131.6 14.1 13.5 Defered Income Tax - Long Term Asset 22.5 23.6 22.6 Discontinued Operations - LT Asset 0.0 Other Long Term Assets 185.2 227.4 71.8 70.1 118.1 Total Assets 2,702.6 2,694.0 2,715.4 3,061.8 3,308.6 Liabilities ($ Millions) 219.3 324.1 Accounts Payable 241.2 253.0 251.7 434.7 Accrued Expenses 250.1 234.2 359.2 473.2Sleep Number Corp | Ratios - Key Metrics Ratios - Key Metrics Industry - Annual Standardised in Millions of U.S. Dollars 2016 2017 2018 2019 2020 Profitability Gross Margin 61.8% 62.1% 60.6% EBITDA Margin 0.2% 10.6% 10.1% 10.3% 13.3% Operating Margin 5.89 6.4% 6.0% 6.6% 10.0% Pretax Margin 5.8% 6.3% 5.6% 5.9% 9.5% Effective Tax Rate 32.3% 30.4% 23.0% 18.6% 20.9% Net Margin 3.9% 4.4% 4.4% DuPont/Earning Power Asset Turnover 2.74 3.11 3.25 2.66 2.31 x Pretax Margin 5.8% 5.3% 5.6% ;.9% 9.5% Pretax ROA 15.9% 19.6% 18.4% x Leverage (Assets/Equity) 2.85 5.29 Pretax ROE 39.7% 73.0%