

Question: Can you help with the Python codes and explain the questions and those parts highlighted in yellow and those parts with dashes/underlines? please assist with
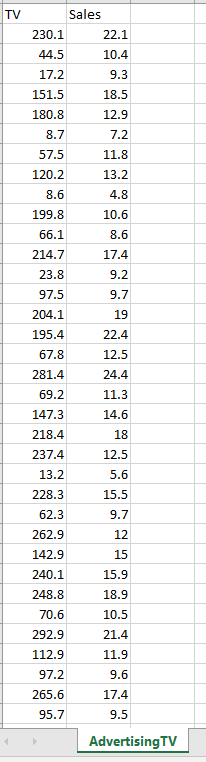
Can you help with the Python codes and explain the questions and those parts highlighted in yellow and those parts with dashes/underlines? please assist with interpretations and comments after plots. AdvertisingTV.csv (200 rows of records)
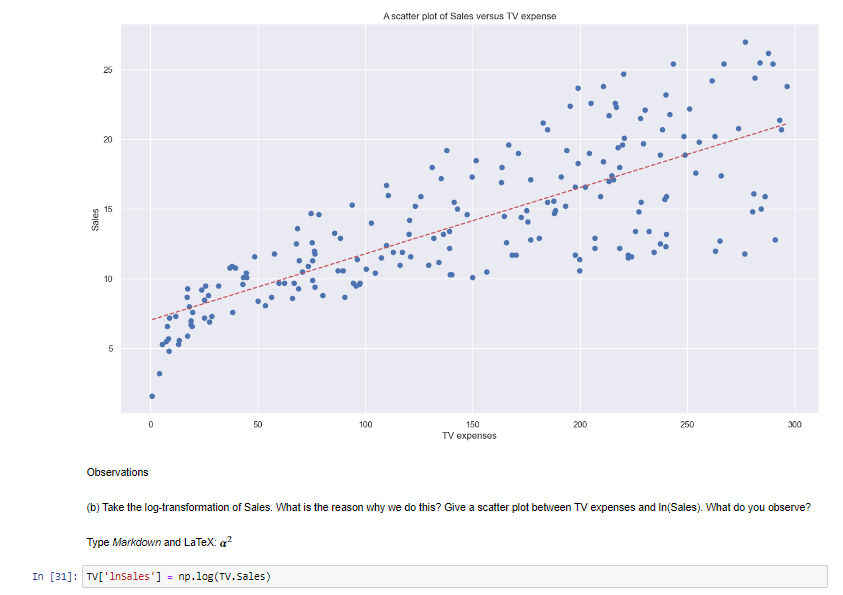
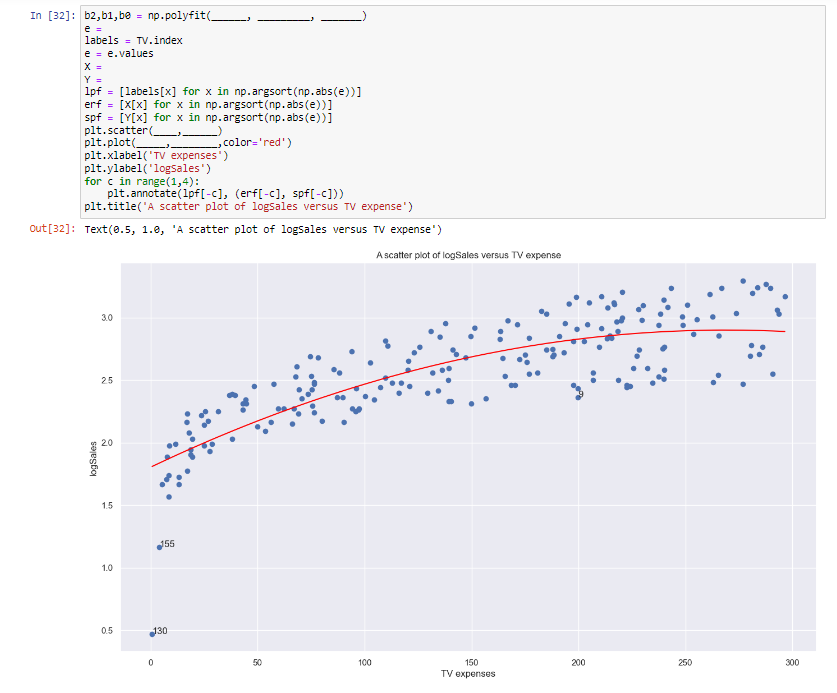
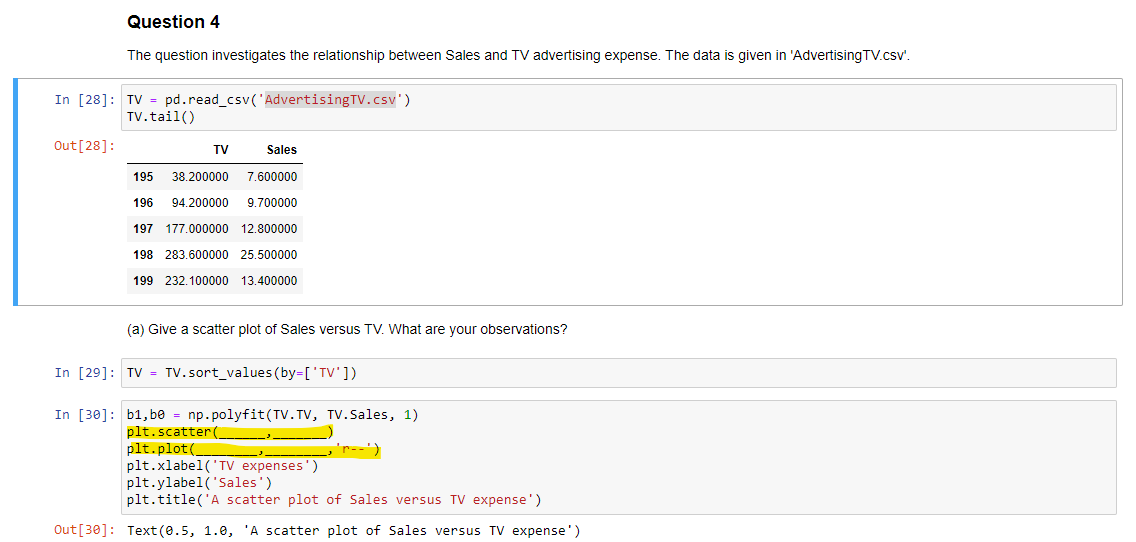
A scatter plot of Sales versus TV expense 25 20 15 Sales 10 0 50 100 150 200 250 300 TV expenses Observations (b) Take the log-transformation of Sales. What is the reason why we do this? Give a scatter plot between TV expenses and In(Sales). What do you observe? Type Markdown and LaTex: a In [31]: TV[' Insales" ] = np. log(TV. Sales)In [32]: b2,b1, be = np. polyfit( e = labels = TV. index e = e. values X = Y = 1pf = [labels [x] for x in np. argsort (np.abs(e))] erf = [x[x] for x in np. argsort(np. abs(@))] spf = [Y[x] for x in np. argsort (np. abs(e))] plt. scatter(_ pit. plot( _, color='red' ) plt. xlabel("TV expenses" ) pit. ylabel( ' logsales" ) for c in range(1,4): plt. annotate(1pf[-c], (erf[-c], spf[-
Step by Step Solution
There are 3 Steps involved in it

Get step-by-step solutions from verified subject matter experts