

Question: Can you help with this problem statistical analysis The table below shows the weight of different cars and how many miles per gallon they get.
Can you help with this problem statistical analysis
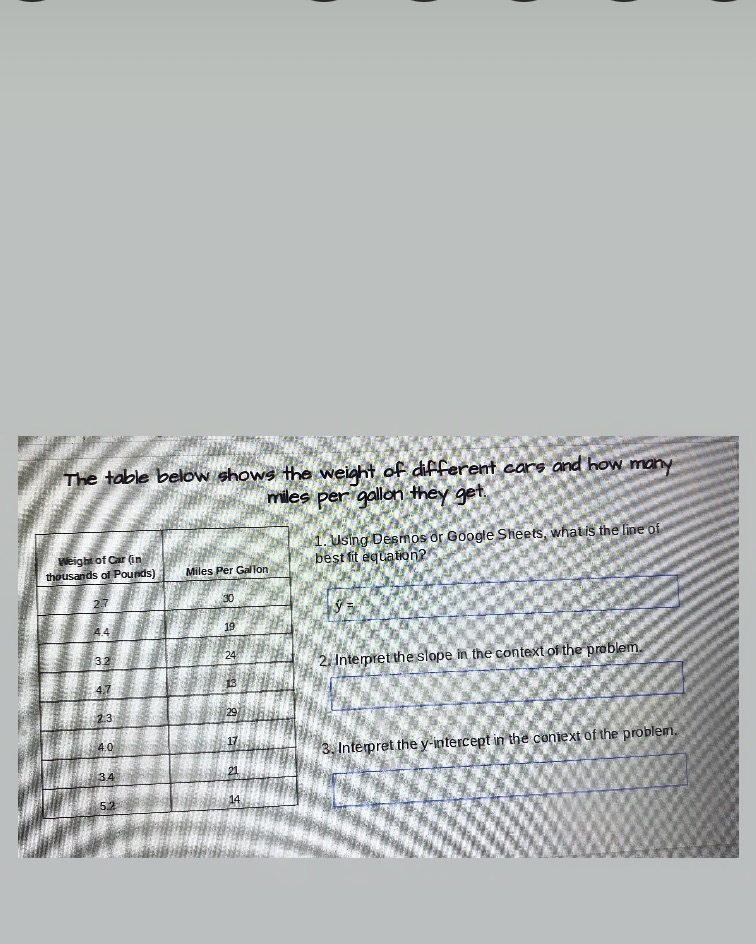
The table below shows the weight of different cars and how many miles per gallon they get. #1. Using Desmos or Google Sheets, what is the line of eight of Car (in thousands of Pounds) Miles Per Gallon best fit equation? 30 4.4 19 3.2 24 2: Interpret the slope in the context of the problem. 4.7 23 29 10 3, Interpret the y-intercept in the context of the problem. 52
Step by Step Solution
There are 3 Steps involved in it
1 Expert Approved Answer
Step: 1 Unlock

Question Has Been Solved by an Expert!
Get step-by-step solutions from verified subject matter experts
Step: 2 Unlock
Step: 3 Unlock