

Question: Can you make a graph and chart in excel using these dates and data , also if possible can you add the steps so I
Can you make a graph and chart in excel using these dates and data , also if possible can you add the steps so I also know how to do it please also can you add (Pentek Update) in subtitle please thank you 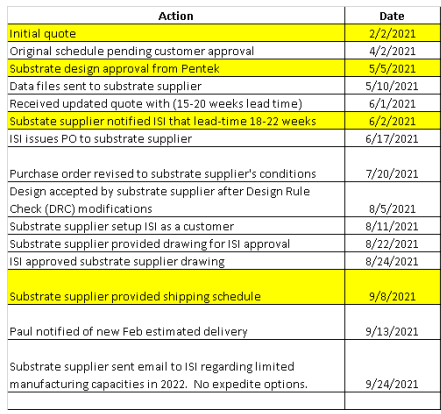
Action Initial quote Original schedule pending customer approval Substrate design approval from Pentek Data files sent to substrate supplier Received updated quote with (15-20 weeks lead time) Substate supplier notified ISI that lead-time 18-22 weeks ISI issues PO to substrate supplier Date 2/2/2021 4/2/2021 5/5/2021 5/10/2021 6/1/2021 6/2/2021 6/17/2021 7/20/2021 Purchase order revised to substrate supplier's conditions Design accepted by substrate supplier after Design Rule Check (DRC) modifications Substrate supplier setup ISI as a customer Substrate supplier provided drawing for ISI approval ISI approved substrate supplier drawing 8/5/2021 8/11/2021 8/22/2021 8/24/2021 Substrate supplier provided shipping schedule 9/8/2021 Paul notified of new Feb estimated delivery 9/13/2021 Substrate supplier sent email to ISI regarding limited manufacturing capacities in 2022. No expedite options. 9/24/2021
Step by Step Solution
There are 3 Steps involved in it

Get step-by-step solutions from verified subject matter experts