Question: Can you make a graph and chart in excel using these dates and data , also if possible can you add the steps so I

Can you make a graph and chart in excel using these dates and data , also if possible can you add the steps so I also know how to do it please also can you add (Pentek Update) in subtitle please thank you Can you make a graph and chart in excel using

Action Initial quote Original schedule pending customer approval Substrate design approval from Pentek Data files sent to substrate supplier Received updated quote with (15-20 weeks lead time) Substate supplier notified ISI that lead-time 18-22 weeks ISI issues PO to substrate supplier Date 2/2/2021 4/2/2021 5/5/2021 5/10/2021 6/1/2021 6/2/2021 6/17/2021 7/20/2021 Purchase order revised to substrate supplier's conditions Design accepted by substrate supplier after Design Rule Check (DRC) modifications Substrate supplier setup ISI as a customer Substrate supplier provided drawing for ISI approval ISI approved substrate supplier drawing 8/5/2021 8/11/2021 8/22/2021 8/24/2021 Substrate supplier provided shipping schedule 9/8/2021 Paul notified of new Feb estimated delivery 9/13/2021 Substrate supplier sent email to ISI regarding limited manufacturing capacities in 2022. No expedite options. 9/24/2021

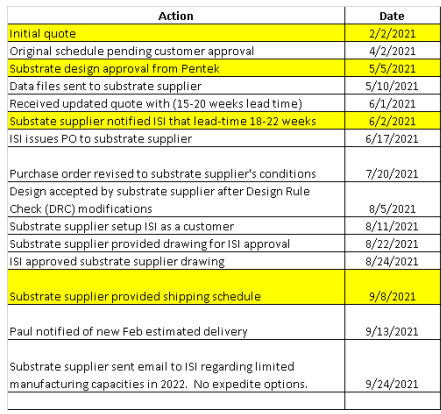
Step by Step Solution

There are 3 Steps involved in it

1 Expert Approved Answer
Step: 1 Unlock blur-text-image
Question Has Been Solved by an Expert!

Get step-by-step solutions from verified subject matter experts

Step: 2 Unlock
Step: 3 Unlock

Students Have Also Explored These Related General Management Questions!