

Question: Can you make the graphs with excel if both graphs properly and answer questions 1,2,3. I will give thumbs up Human Population Lab Problem Statement:
Can you make the graphs with excel if both graphs properly and answer questions 1,2,3. I will give thumbs up
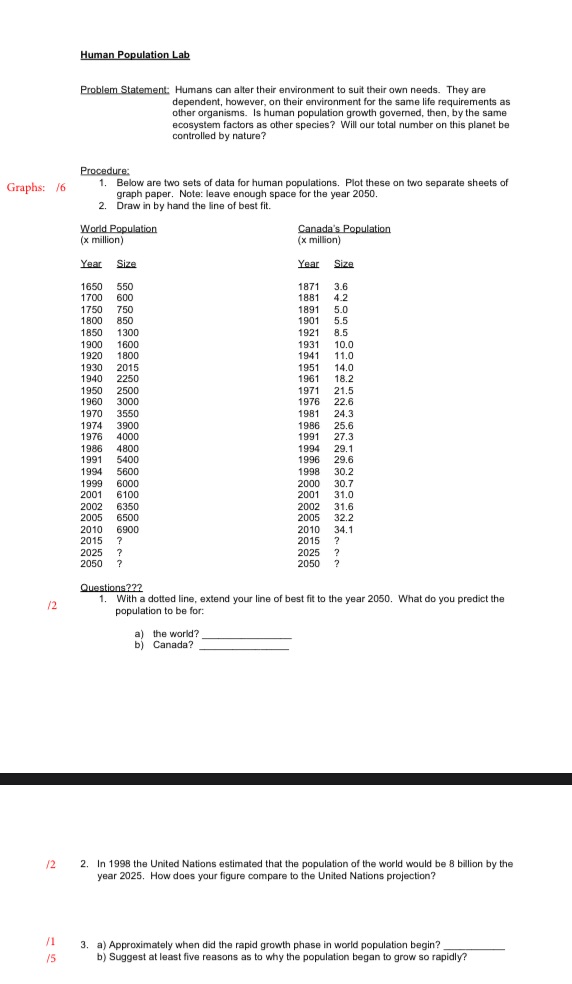
Human Population Lab Problem Statement: Humans can alter their environment to suit their own needs. They are dependent, however, on their environment for the same life requirements as other organisms. Is human population growth governed, then, by the same ecosystem factors as other species? Will our total number on this planet be controlled by nature? Procedure: Graphs: 16 1. Below are two sets of data for human populations. Plot these on two separate sheets of graph paper. Note: leave enough space for the year 2050. 2. Draw in by hand the line of best fit. World Population Canada's Population (x million) (x million) Year Size Year Size 1650 550 1871 3.6 1700 600 1881 4.2 1750 750 189 5.0 1800 850 1901 5.5 1850 1300 1921 8.5 1900 1600 1931 10.0 1920 1800 1941 11.0 1930 2015 1951 14.0 1940 2250 1961 18.2 1950 2500 1971 21.5 1960 3000 1976 22.6 1970 3550 1981 24.3 1974 3900 1986 25.6 1976 4000 1991 27.3 1986 4800 1994 29.1 1991 5400 1996 29.6 1994 5600 1998 30.2 1999 6000 2000 30.7 2001 6100 2001 31.0 2002 6350 2002 31.6 2005 6500 2005 32.2 2010 6900 2010 34.1 2015 ? 2015 2025 2025 2050 2050 Questions?72 /2 1. With a dotted line, extend your line of best fit to the year 2050. What do you predict the population to be for: a) the world? Canada? /2 2. In 1998 the United Nations estimated that the population of the world would be 8 billion by the year 2025. How does your figure compare to the United Nations projection? /1 3. a) Approximately when did the rapid growth phase in world population begin?_ 15 b) Suggest at least five reasons as to why the population began to grow so rapidly
Step by Step Solution
There are 3 Steps involved in it

Get step-by-step solutions from verified subject matter experts