Question: can you please answer this question? John is advising students for the next semester and wants to see how long the students are waiting outside

can you please answer this question? can you please answer this question? John is
can you please answer this question? John is
John is advising students for the next semester and wants to see how long the students are waiting outside her office. Over the course of a week, she logs the wait times for 4 different students per day (sample size). He does this for 30 days that month. Looking at all the data she collected, she finds that the overall average wait time (mean of means) is 10.4 minutes, with an overall average range of 0.9 minutes (meaning the students are waiting between 9.5 to 11.3 minutes, on average). Compute the following: - RR - upper and lower control limits for X chart (total of two values). Reminder: UCL and LCL for X=X+/(A2R) - upper and lower control limits for R chart (total of two values). Reminder: UCL for R=(D4R) and LCL for R=(D3R) Control Chart Factors can be looked up in the following table

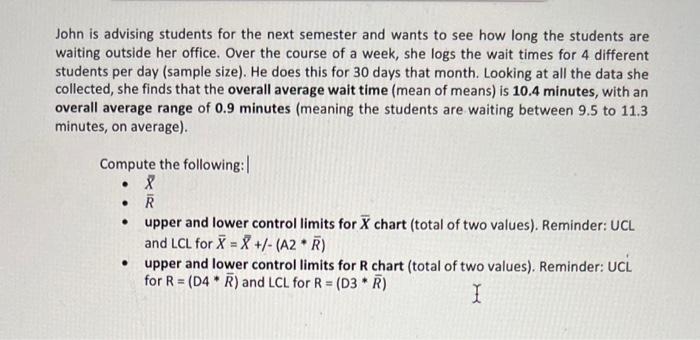
Step by Step Solution

There are 3 Steps involved in it

1 Expert Approved Answer
Step: 1 Unlock blur-text-image
Question Has Been Solved by an Expert!

Get step-by-step solutions from verified subject matter experts

Step: 2 Unlock
Step: 3 Unlock

Students Have Also Explored These Related General Management Questions!