

Question: can you please assist Graph 2: Paste below a copy of your graph after Step 10 from Activity 1. 1. Compare the graphs from step
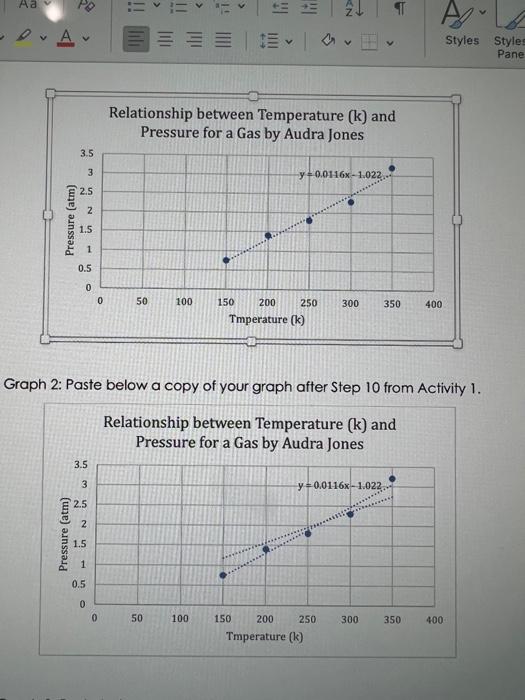
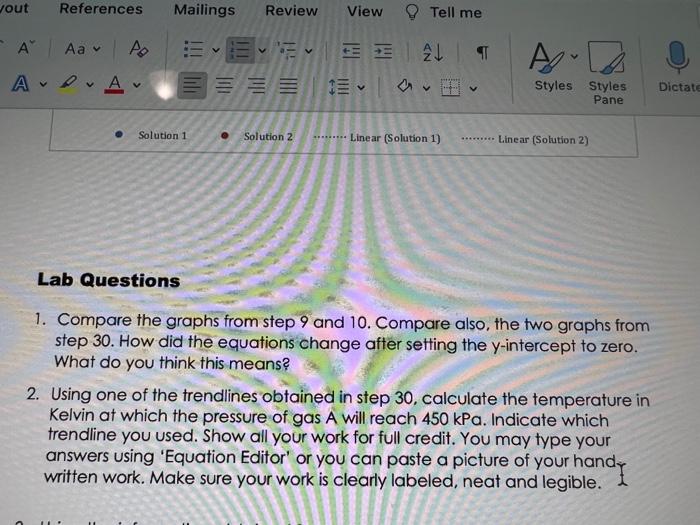
Graph 2: Paste below a copy of your graph after Step 10 from Activity 1. 1. Compare the graphs from step 9 and 10. Compare also, the two graphs from step 30. How did the equations change after setting the y-intercept to zero. What do you think this means? 2. Using one of the trendlines obtained in step 30 , calculate the temperature in Kelvin at which the pressure of gas A will reach 450kPa. Indicate which trendline you used. Show all your work for full cre dit. You may type your answers using 'Equation Editor' or you can paste a picture of your hand written work. Make sure your work is clearly labeled, neat and legible. Graph 2: Paste below a copy of your graph after Step 10 from Activity 1. 1. Compare the graphs from step 9 and 10. Compare also, the two graphs from step 30. How did the equations change after setting the y-intercept to zero. What do you think this means? 2. Using one of the trendlines obtained in step 30 , calculate the temperature in Kelvin at which the pressure of gas A will reach 450kPa. Indicate which trendline you used. Show all your work for full cre dit. You may type your answers using 'Equation Editor' or you can paste a picture of your hand written work. Make sure your work is clearly labeled, neat and legible
Step by Step Solution
There are 3 Steps involved in it

Get step-by-step solutions from verified subject matter experts