

Question: Can you please describe what the visual graph for operating expesnses is representing. Struggling student, thank you. Revenue Spending Instruction 1 (2020) Instruction 1 (2021)
Can you please describe what the visual graph for operating expesnses is representing. Struggling student, thank you. 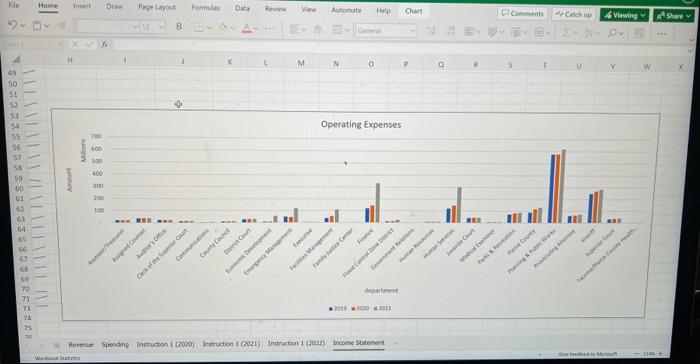
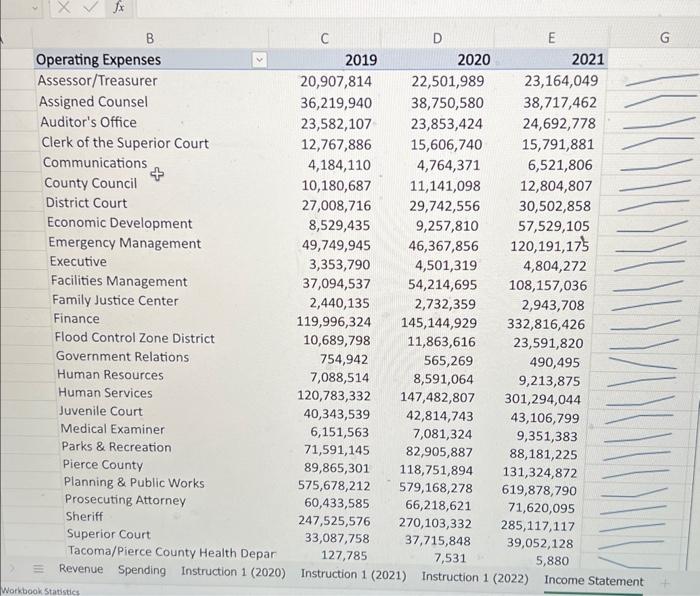
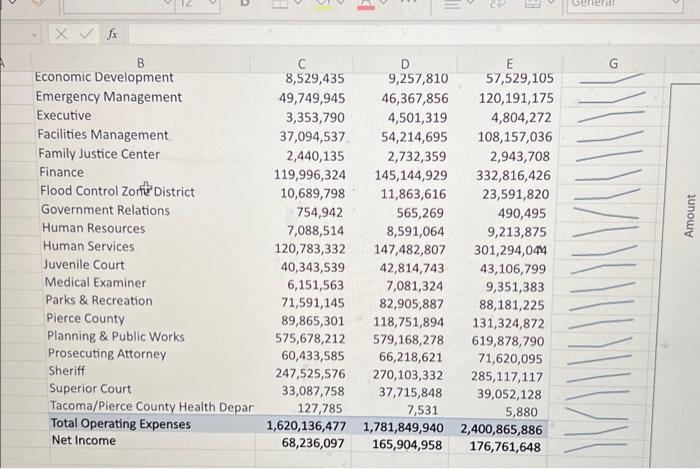
Revenue Spending Instruction 1 (2020) Instruction 1 (2021) Instruction 1 (2022) Income Statement Revenue Spending Instruction 1 (2020) Instruction 1 (2021) Instruction 1 (2022) Income Statement
Step by Step Solution
There are 3 Steps involved in it
1 Expert Approved Answer
Step: 1 Unlock

Question Has Been Solved by an Expert!
Get step-by-step solutions from verified subject matter experts
Step: 2 Unlock
Step: 3 Unlock