

Question: can you please draw the graphs for part d, e and f too for this question Suppose that the economy's long-run output level is produced
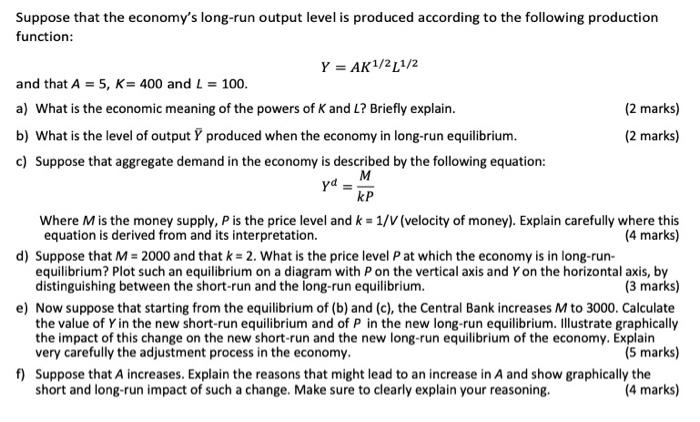
Suppose that the economy's long-run output level is produced according to the following production function: and that A=5,K=400 and L=100. Y=AK1/2L1/2 a) What is the economic meaning of the powers of K and L ? Briefly explain. (2 marks) b) What is the level of output Y produced when the economy in long-run equilibrium. (2 marks) c) Suppose that aggregate demand in the economy is described by the following equation: Yd=kPM Where M is the money supply, P is the price level and k=1/V (velocity of money). Explain carefully where this equation is derived from and its interpretation. (4 marks) d) Suppose that M=2000 and that k=2. What is the price level P at which the economy is in long-runequilibrium? Plot such an equilibrium on a diagram with P on the vertical axis and Y on the horizontal axis, by distinguishing between the short-run and the long-run equilibrium. (3 marks) e) Now suppose that starting from the equilibrium of (b) and (c), the Central Bank increases M to 3000 . Calculate the value of Y in the new short-run equilibrium and of P in the new long-run equilibrium. Illustrate graphically the impact of this change on the new short-run and the new long-run equilibrium of the economy. Explain very carefully the adjustment process in the economy. (5 marks) f) Suppose that A increases. Explain the reasons that might lead to an increase in A and show graphically the short and long-run impact of such a change. Make sure to clearly explain your reasoning. (4 marks)
Step by Step Solution
There are 3 Steps involved in it

Get step-by-step solutions from verified subject matter experts