

Question: Can you please explain and fill out the graph? On the NMR chart given, sketch the expected proton NMR spectrum of the compound shown below.
Can you please explain and fill out the graph? 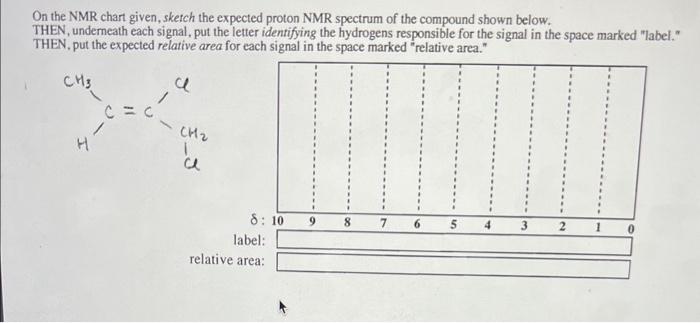
On the NMR chart given, sketch the expected proton NMR spectrum of the compound shown below. THEN, underneath each signal, put the letter identifying the hydrogens responsible for the signal in the space marked "label." THEN, put the expected relative area for each signal in the space marked "relative area
Step by Step Solution
There are 3 Steps involved in it
1 Expert Approved Answer
Step: 1 Unlock

Question Has Been Solved by an Expert!
Get step-by-step solutions from verified subject matter experts
Step: 2 Unlock
Step: 3 Unlock