

Question: CAN YOU PLEASE EXPLAIN ANSWER 2/3 Question 4: (20 Marks/ There are given Portfolios of White, Black and Grey based on the following data. Note
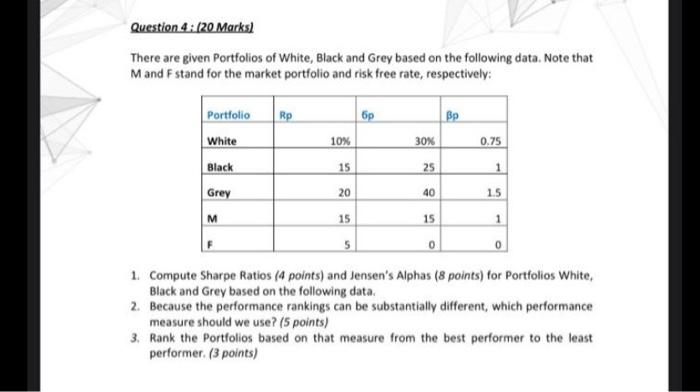
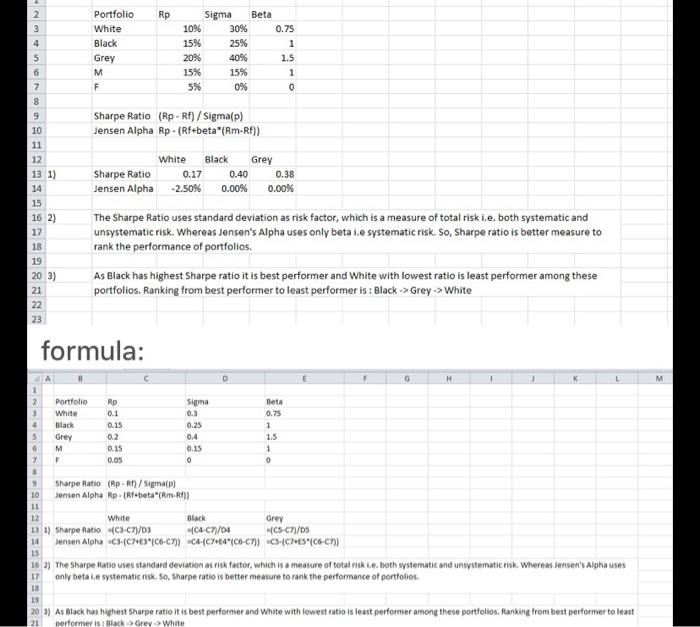
Question 4: (20 Marks/ There are given Portfolios of White, Black and Grey based on the following data. Note that Mand F stand for the market portfolio and risk free rate, respectively: Rp | Bp 10% 30% 0.75 Portfolio White Black Grey 15 25 1 20 40 1.5 M 15 15 1 5 0 0 1. Compute Sharpe Ratios (4 points) and Jensen's Alphas (8 points) for Portfolios White, Black and Grey based on the following data. 2. Because the performance rankings can be substantially different, which performance measure should we use? (5 points) 3. Rank the Portfolios based on that measure from the best performer to the least performer (3 points) Rp 2 3 4 5 6 7 8 9 Portfolio White Black Grey M F Sigma Beta 10% 30% 15% 25% 20% 40% 15% 15% 5% 0% 0.75 1 1.5 1 0 Sharpe Ratio (Rp - Rf) / Sigma(p) Jensen Alpha Rp - (Rf+beta"(Rm-Rf)) Sharpe Ratio Jensen Alpha White Black Grey 0.17 0.40 0.38 -2.50% 0.00% 0.00% 10 11 12 13 1) 14 15 16 2) 17 18 19 203) 21 22 23 The Sharpe Ratio uses standard deviation as risk factor, which is a measure of total risk i.e. both systematic and unsystematic risk. Whereas Jensen's Alpha uses only beta .e systematic risk. So, Sharpe ratio is better measure to rank the performance of portfolios. As Black has highest Sharpe ratio it is best performer and White with lowest ratio is least performer among these portfolios. Ranking from best performer to least performer is : Black -> Grey -> White formula: G H M 1 2 4 Portfolio White Black Grey M F Rp 0.1 0.15 0.2 0.15 0.05 Sigma 0.3 0.25 04 0.15 o Beta 0.75 1 1.5 1 0 6 7 9 Sharpe Ratio (Rp - Rt) / Sigmap) 10 Jensen Alpha Rp. (Rtbeta"(Rm-R)) 11 12 White Black Grey 13 1) Sharpe Ratio C1-C7/03 -C4C7\/ -C5-C7/05 14 Jensen Alpha CH-ICE"(C6-cm) 6-(07044"/C6-C7)) --C865"/C6-07) 162) The Sharpe Ratio uses standard deviation as risk factor, which is a measure of totat risk Le both systematic and unsystematic risk. Whereas Jensen's Alphauses 17 only betale systematic risk. 50, Sharpe ratio is better measure to rank the performance of portfolios 11 20 2) As Black has highest Sharpe ratio it is best performer and White with lowest ratio is toast performer among these portfollos. Ranking from best performer to least 15 19 21 performeris: black > Grey > White
Step by Step Solution
There are 3 Steps involved in it

Get step-by-step solutions from verified subject matter experts