

Question: Can you please explain how to a) Plot Canada's production possibilities curve by plotting at least 3 points on the curve and b) How much
Can you please explain how to a) Plot Canada's production possibilities curve by plotting at least 3 points on the curve and
b)How much of each good is produced if each worker specializes according to comparative advantage ?
Thank you.
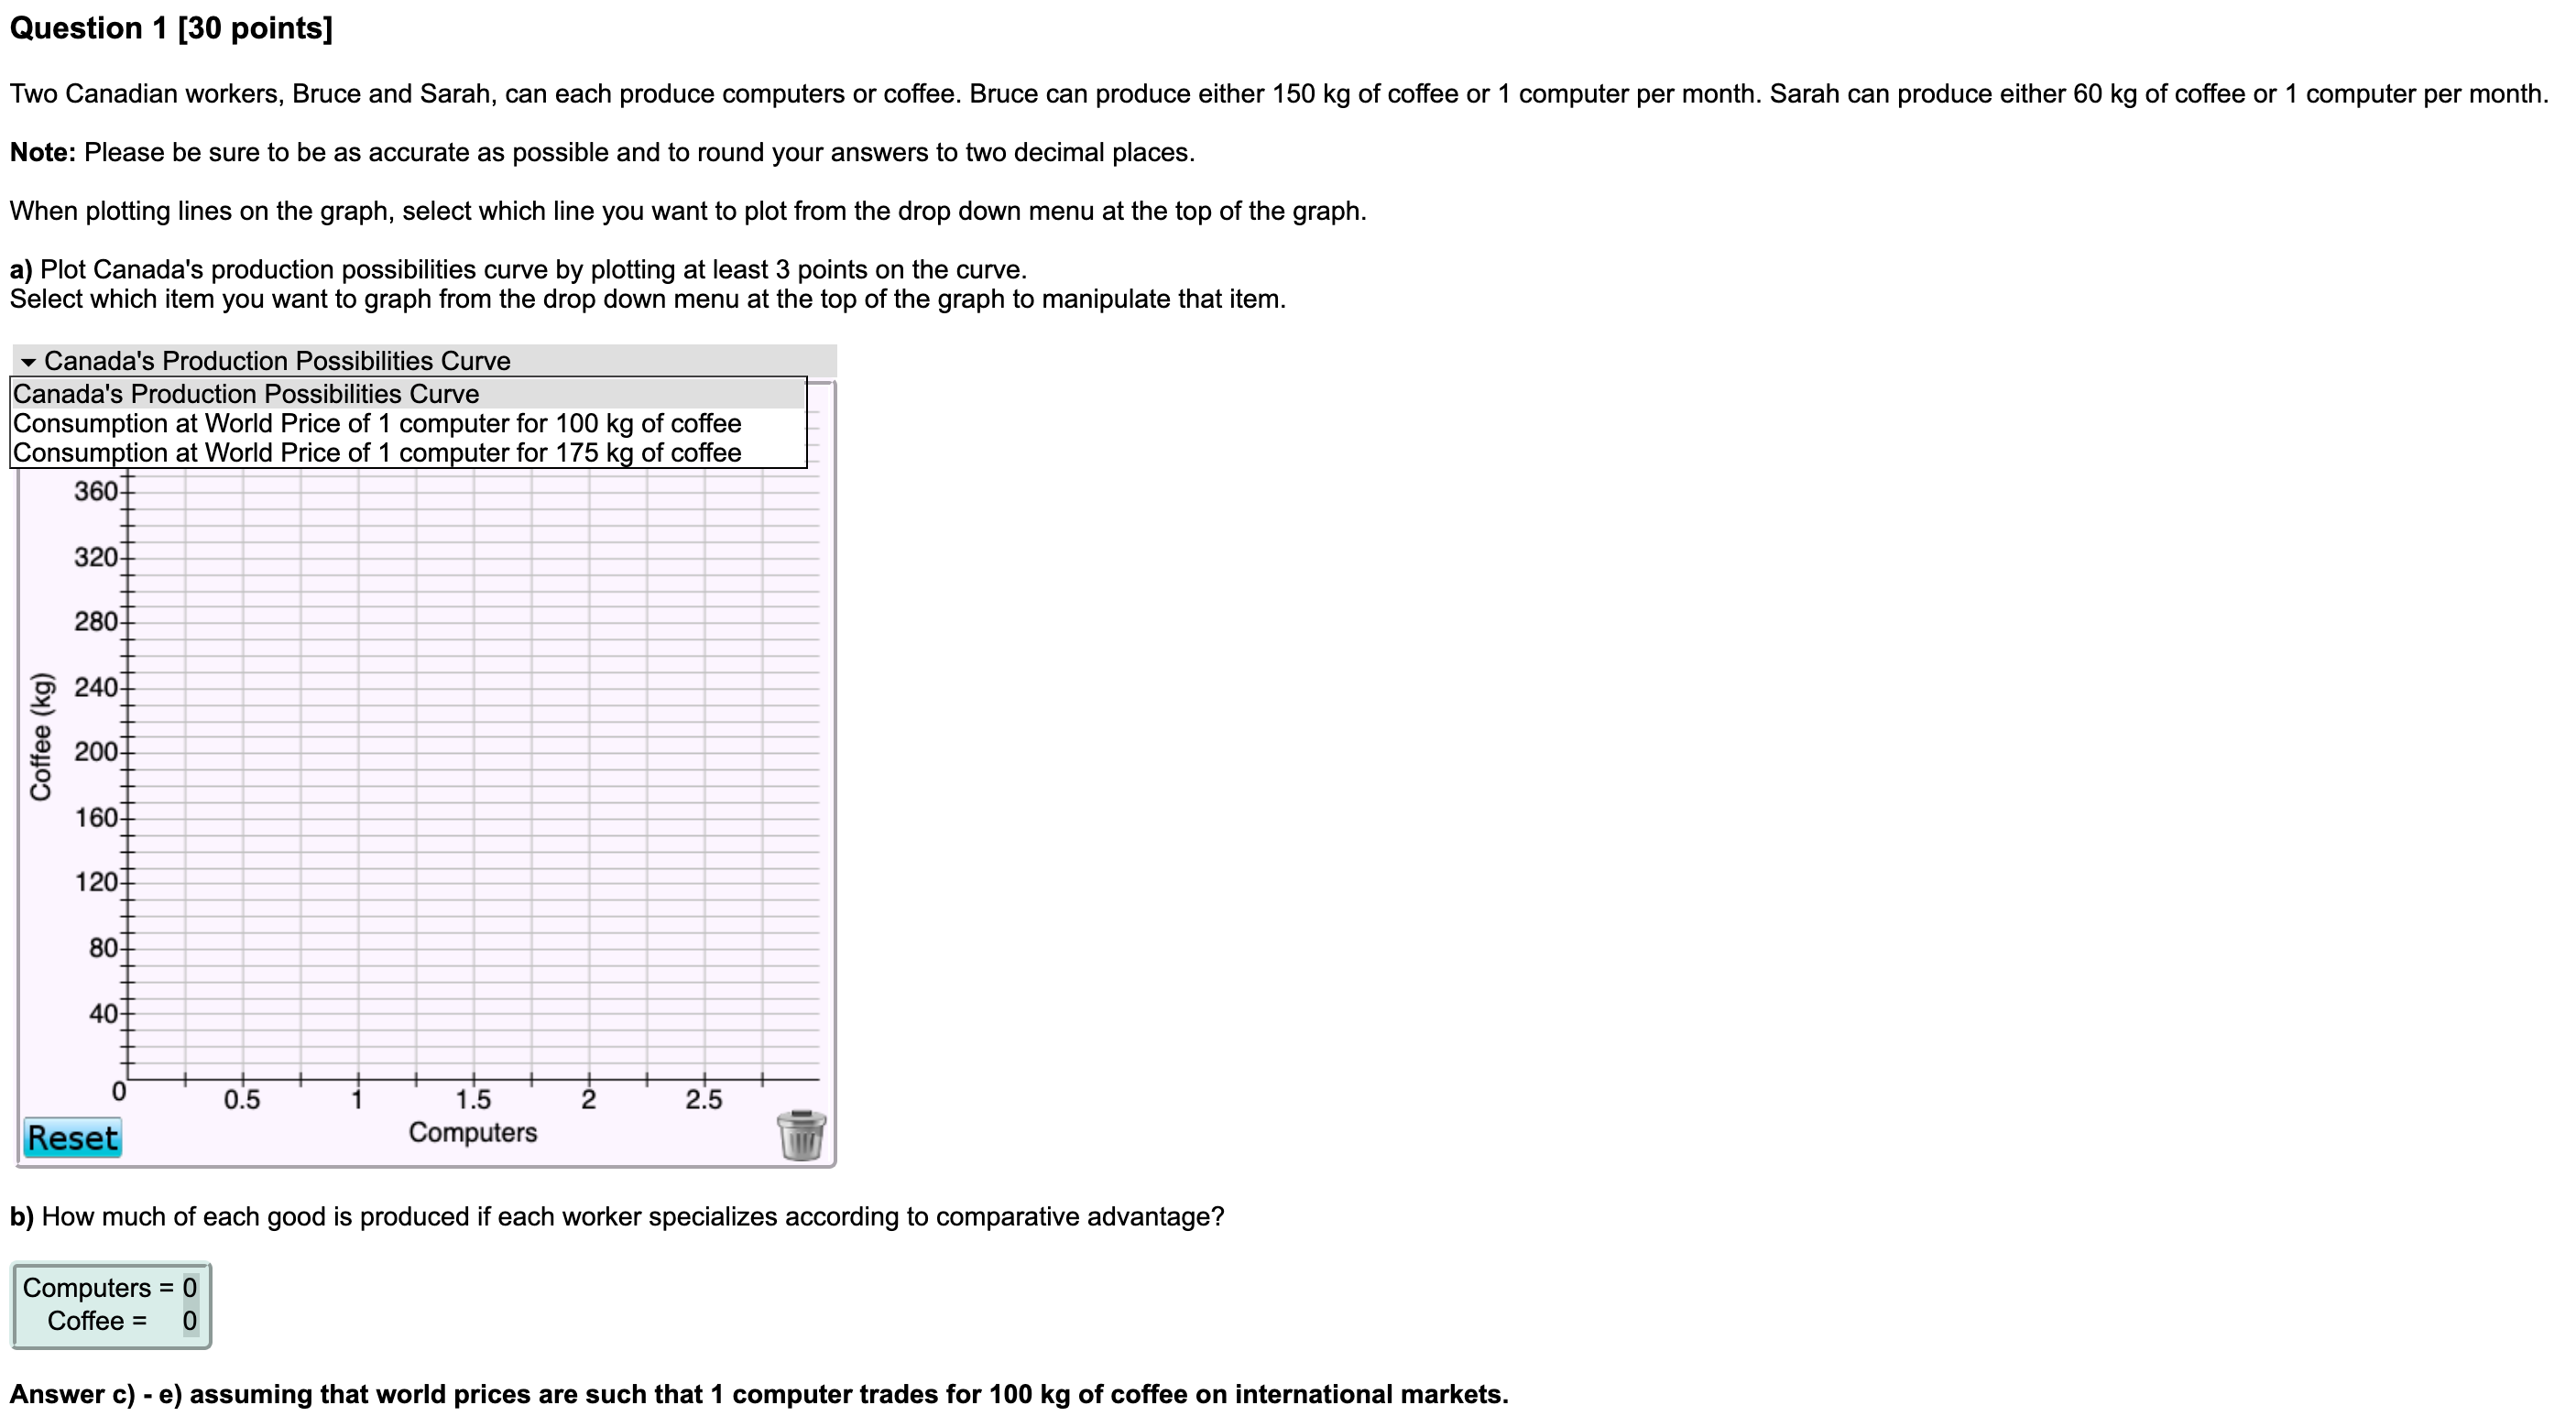
Question 1 [30 points] Two Canadian workers, Bruce and Sarah, can each produce computers or coffee. Bruce can produce either 150 kg of coffee or 1 computer per month. Sarah can produce either 60 IQ of coffee or 1 computer per month. Note: Please be sure to be as accurate as possible and to round your answers to two decimal places. When plotting lines on the graph, select which line you want to plot from the drop down menu at the top of the graph. a) Plot Canada's production possibilities curve by plotting at least 3 points on the curve. Select which item you want to graph from the drop down menu at the top of the graph to manipulate that item. v Canada's Production Possibilities Curve Canada's Production Possibilities Curve Consumption at World Price of 1 computer for 100 kg of coffee Consum tion at World Price of 1 computer for 175 kg of coffee b) How much of each good is produced if each worker specializes according to comparative advantage? Answer c) - e) assuming that world prices are such that 1 computer trades for 100 kg of coffee on international markets
Step by Step Solution
There are 3 Steps involved in it

Get step-by-step solutions from verified subject matter experts