

Question: b) Plot France's production possibilities curve by plotting at least 2 points on the curve on the graph above. c) What is each country's
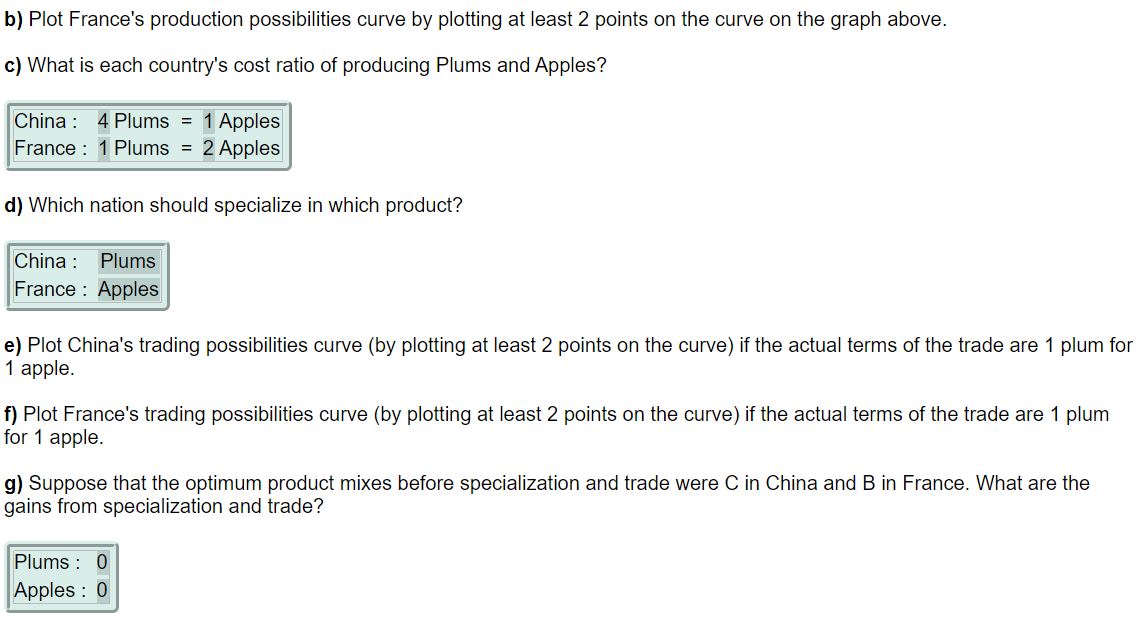
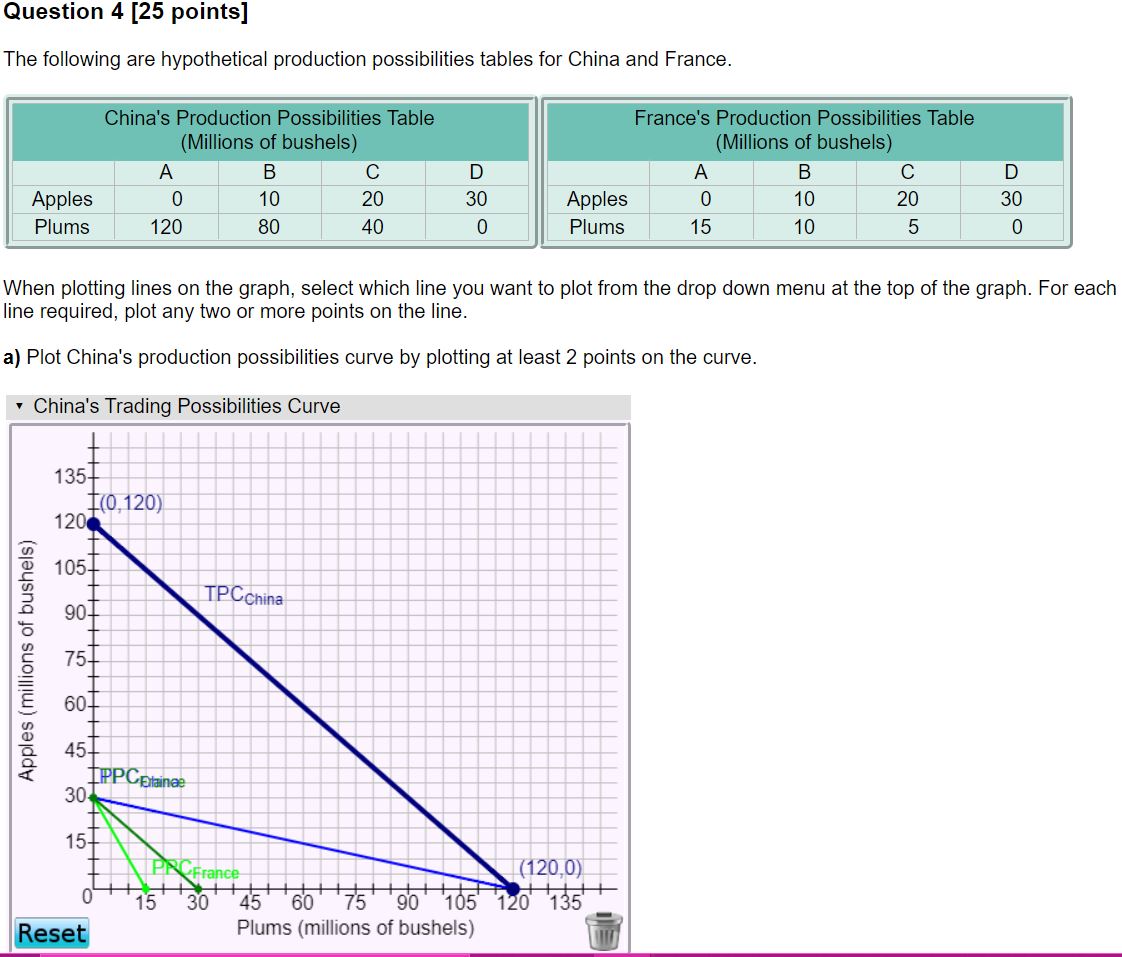
b) Plot France's production possibilities curve by plotting at least 2 points on the curve on the graph above. c) What is each country's cost ratio of producing Plums and Apples? China: 4 Plums = 1 Apples France : 1 Plums = *Apples d) Which nation should specialize in which product? China: Plums France : Apples e) Plot China's trading possibilities curve (by plotting at least 2 points on the curve) if the actual terms of the trade are 1 plum for 1 apple. f) Plot France's trading possibilities curve (by plotting at least 2 points on the curve) if the actual terms of the trade are 1 plum for 1 apple. g) Suppose that the optimum product mixes before specialization and trade were C in China and B in France. What are the gains from specialization and trade? Plums : pples : 0]
Step by Step Solution
There are 3 Steps involved in it

Get step-by-step solutions from verified subject matter experts