

Question: can you please explain how to answer this step by step please and if you could explain how to draw the graph it would be
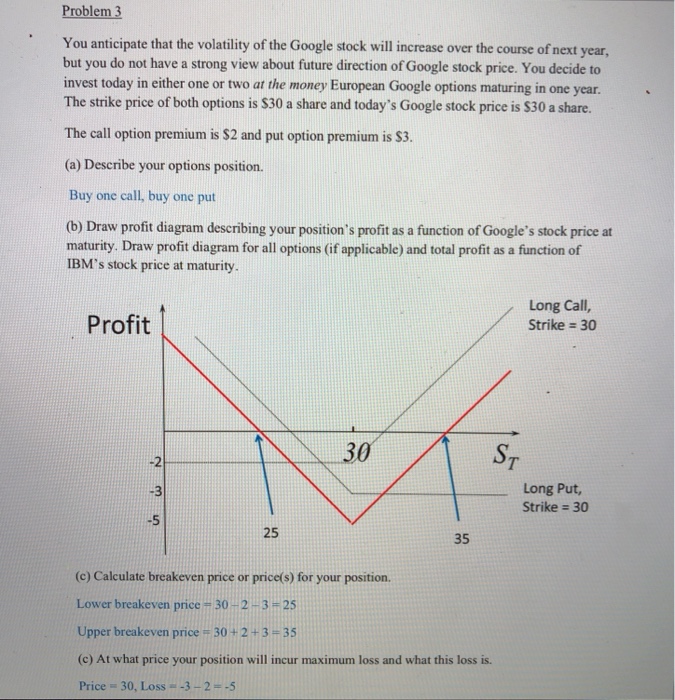
Problem 3 You anticipate that the volatility of the Google stock will increase over the course of next year, but you do not have a strong view about future direction of Google stock price. You decide to invest today in either one or two at the money European Google options maturing in one year The strike price of both options is $30 a share and today's Google stock price is $30 a share. The call option premium is $2 and put option premium is S3. (a) Describe your options position. Buy one call, buy one put (b) Draw profit diagram describing your position's profit as a function of Google's stock price at maturity. Draw profit diagram for all options (if applicable) and total profit as a function of IBM's stock price at maturity Profit Long Call, Strike 30 30 -2 -3 -5 Long Put, Strike 30 25 35 (c) Calculate breakeven price or prices) for your position. Lower breakeven price = 30-2-3 # 25 Upper breakeven price 30+2+3-35 (c) At what price your position will incur maximum loss and what this loss is. Price = 30, Loss "-3-2-=-5
Step by Step Solution
There are 3 Steps involved in it

Get step-by-step solutions from verified subject matter experts