

Question: can you please help me answer if it's A, B , C or D? Assume that the readings on the thermometers are normally distributed with
can you please help me answer if it's A, B , C or D?
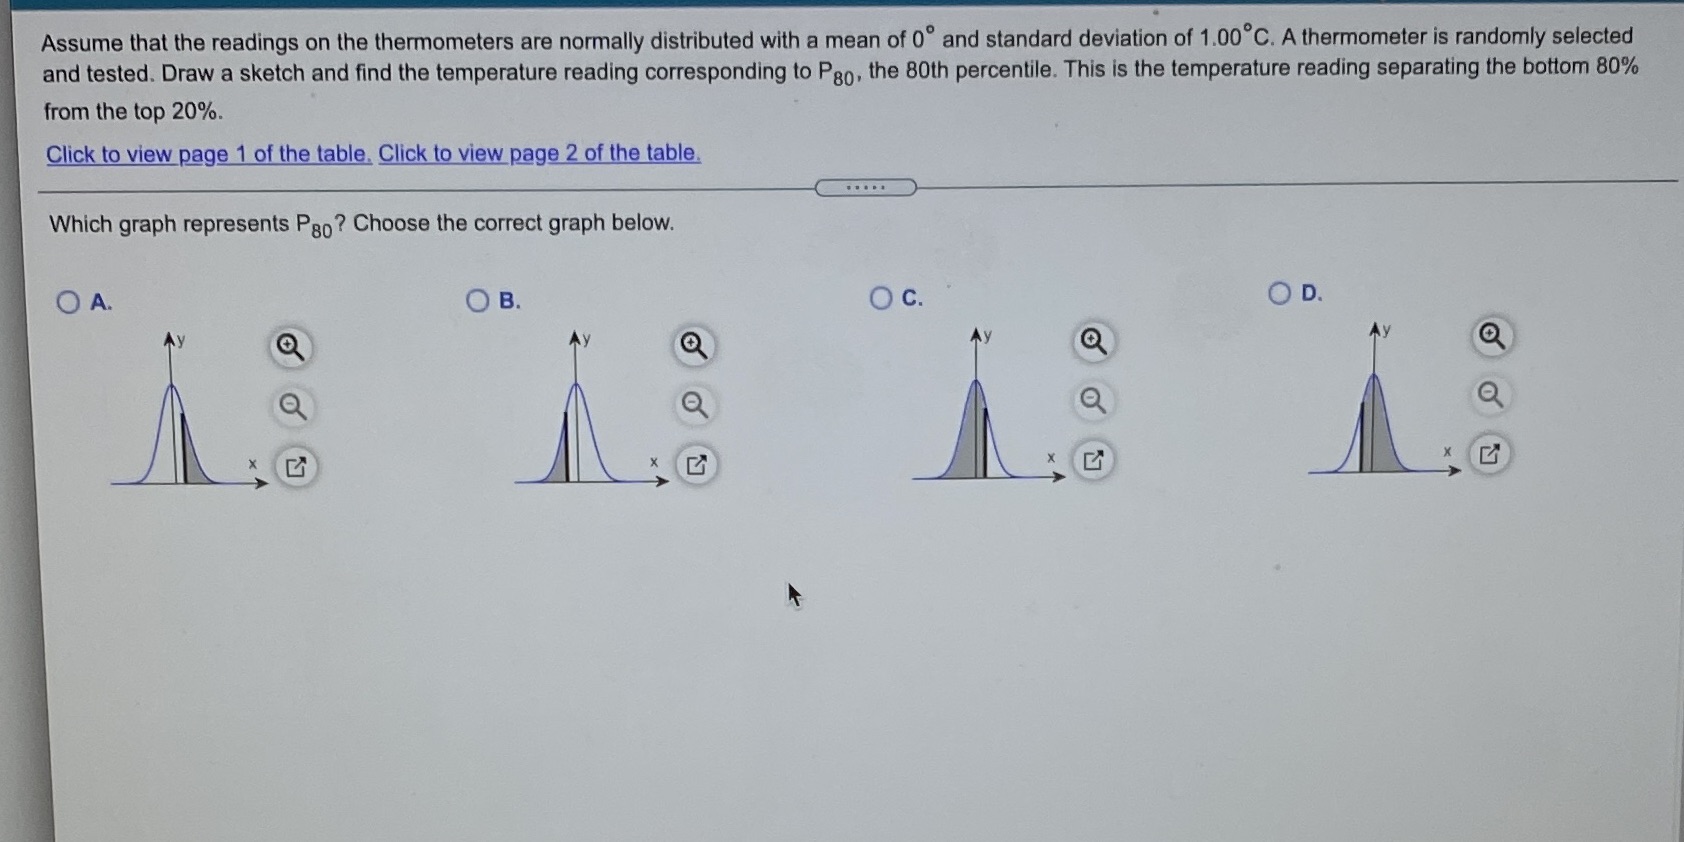
Assume that the readings on the thermometers are normally distributed with a mean of 0 and standard deviation of 1.00 C. A thermometer is randomly selected and tested. Draw a sketch and find the temperature reading corresponding to Po, the 80th percentile. This is the temperature reading separating the bottom 80% from the top 20%. Click to view page 1 of the table. Click to view page 2 of the table. Which graph represents Poo? Choose the correct graph below. O A. O B. O c. OD. Ay X X
Step by Step Solution
There are 3 Steps involved in it
1 Expert Approved Answer
Step: 1 Unlock

Question Has Been Solved by an Expert!
Get step-by-step solutions from verified subject matter experts
Step: 2 Unlock
Step: 3 Unlock