

Question: can you please help me answer is this A, B , C or D? Assume that the readings on the thermometers are normally distributed with
can you please help me answer is this A, B , C or D?
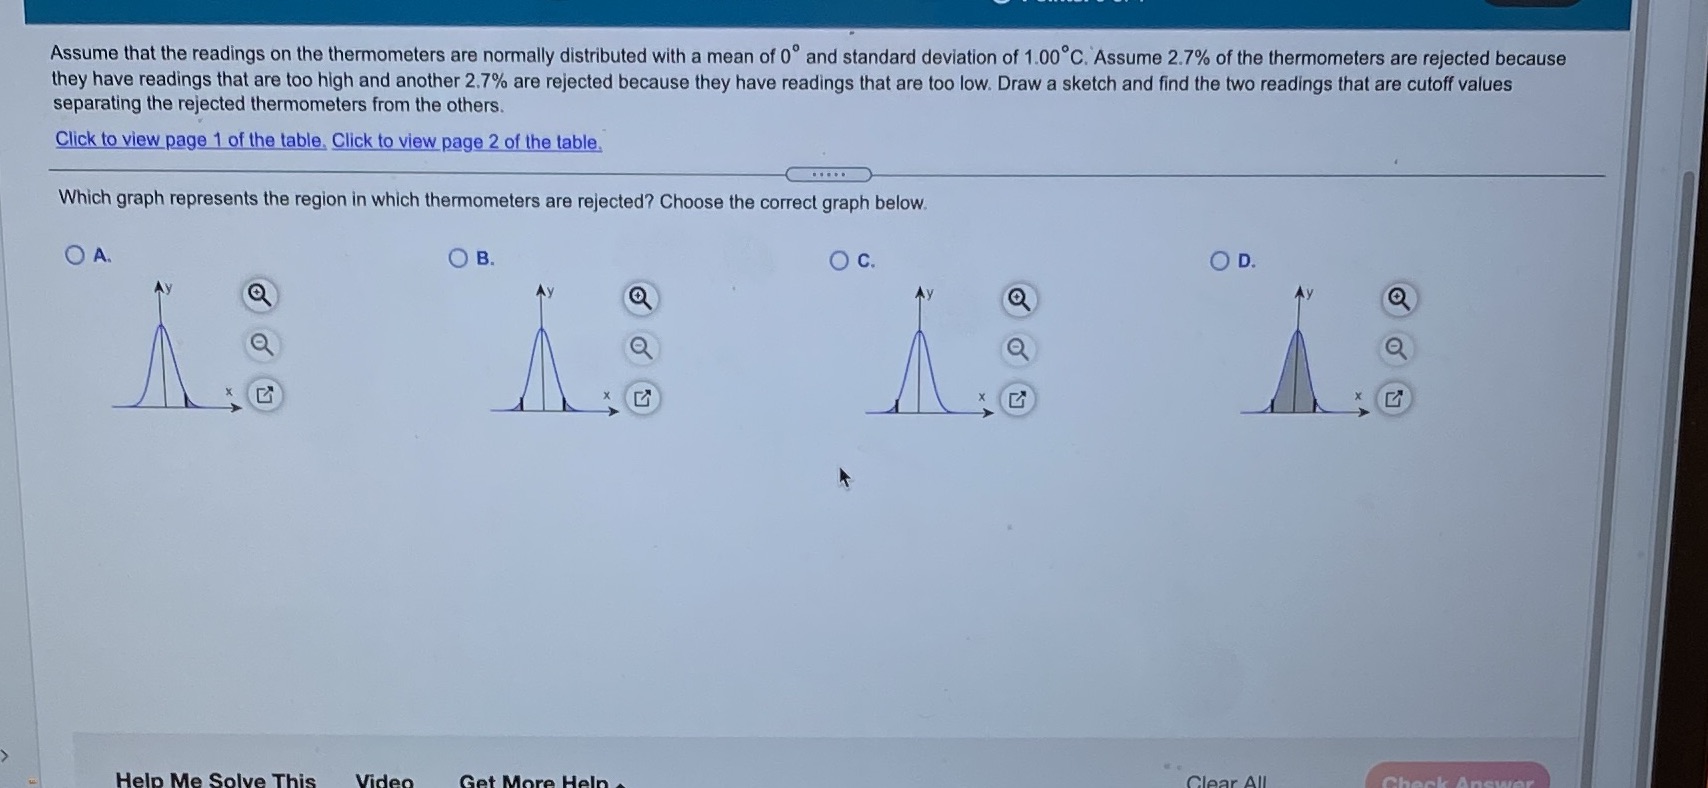
Assume that the readings on the thermometers are normally distributed with a mean of 0 and standard deviation of 1.00 C. Assume 2.7% of the thermometers are rejected because they have readings that are too high and another 2.7% are rejected because they have readings that are too low. Draw a sketch and find the two readings that are cutoff values separating the rejected thermometers from the others. Click to view page 1 of the table. Click to view page 2 of the table. Which graph represents the region in which thermometers are rejected? Choose the correct graph below. O A. O B. O C. O D. Q Help Me Solve This Video Get More Help AIL
Step by Step Solution
There are 3 Steps involved in it

Get step-by-step solutions from verified subject matter experts