

Question: Can you please help me answer the second question? Assume that the readings on the thermometers are normally distributed with a mean of 0 and
Can you please help me answer the second question?
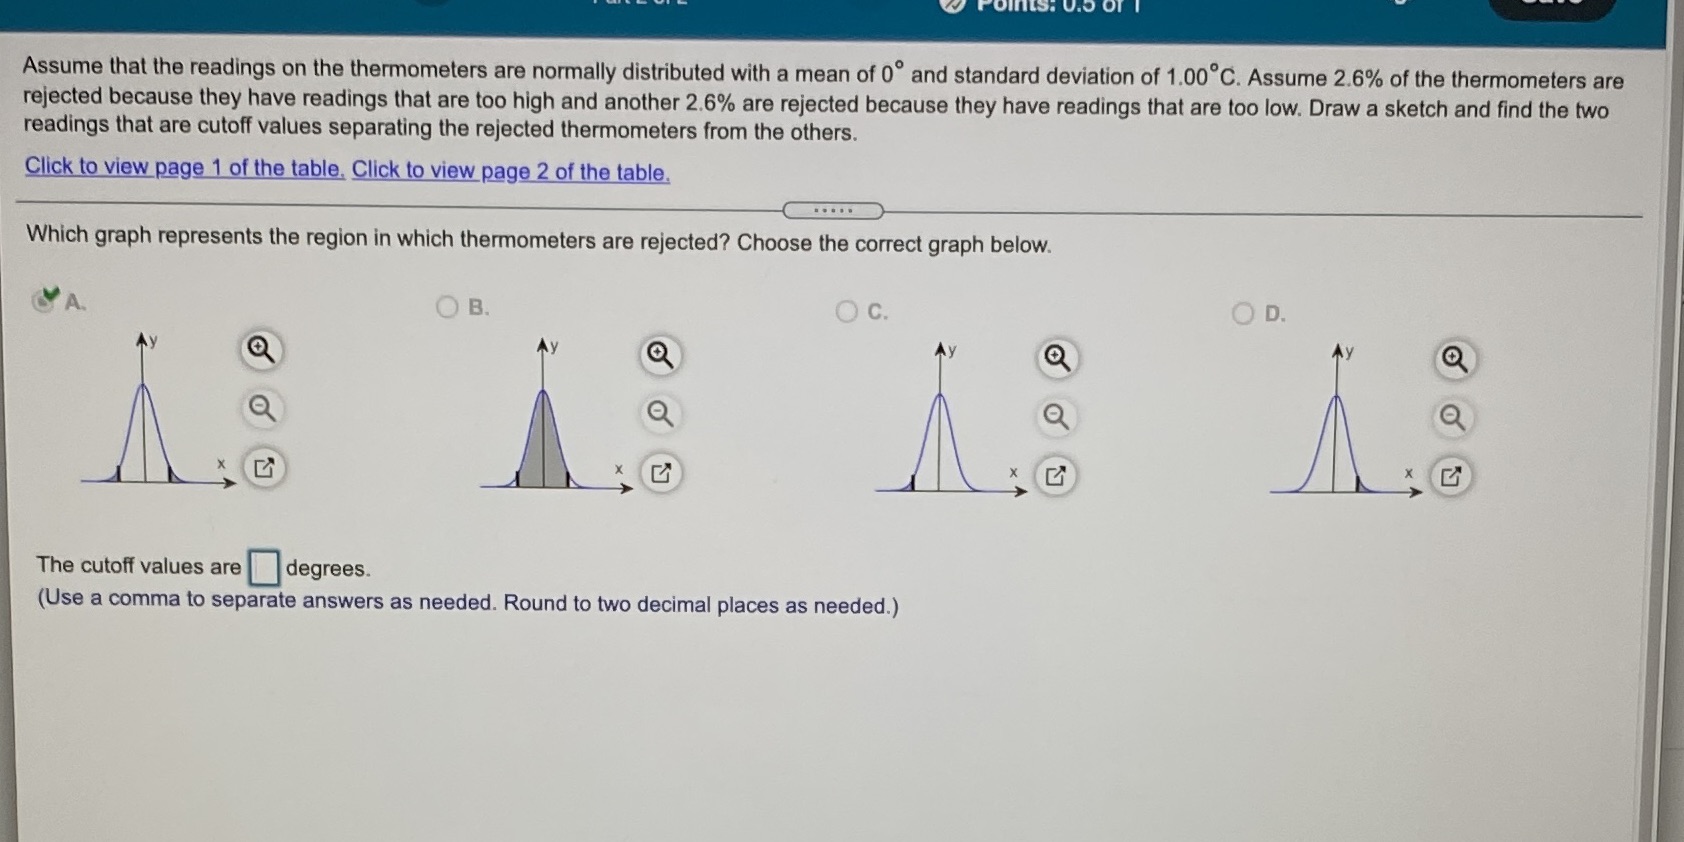
Assume that the readings on the thermometers are normally distributed with a mean of 0 and standard deviation of 1.00 C. Assume 2.6% of the thermometers are rejected because they have readings that are too high and another 2.6% are rejected because they have readings that are too low. Draw a sketch and find the two readings that are cutoff values separating the rejected thermometers from the others. Click to view page 1 of the table. Click to view page 2 of the table. . ... . Which graph represents the region in which thermometers are rejected? Choose the correct graph below. A. O B. O c. OD. O O Ay X The cutoff values are degrees. (Use a comma to separate answers as needed. Round to two decimal places as needed.)
Step by Step Solution
There are 3 Steps involved in it

Get step-by-step solutions from verified subject matter experts