

Question: Can you please help me answer this Physics lab 9 pages 4 and 5? I already have a raw data provided on the last page.
Can you please help me answer this Physics lab 9 pages 4 and 5? I already have a raw data provided on the last page.
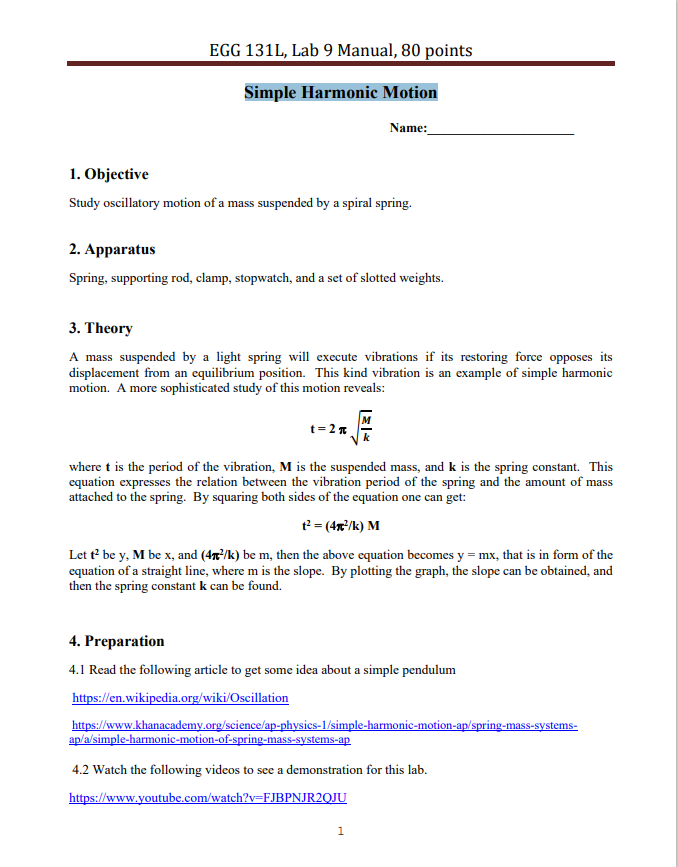
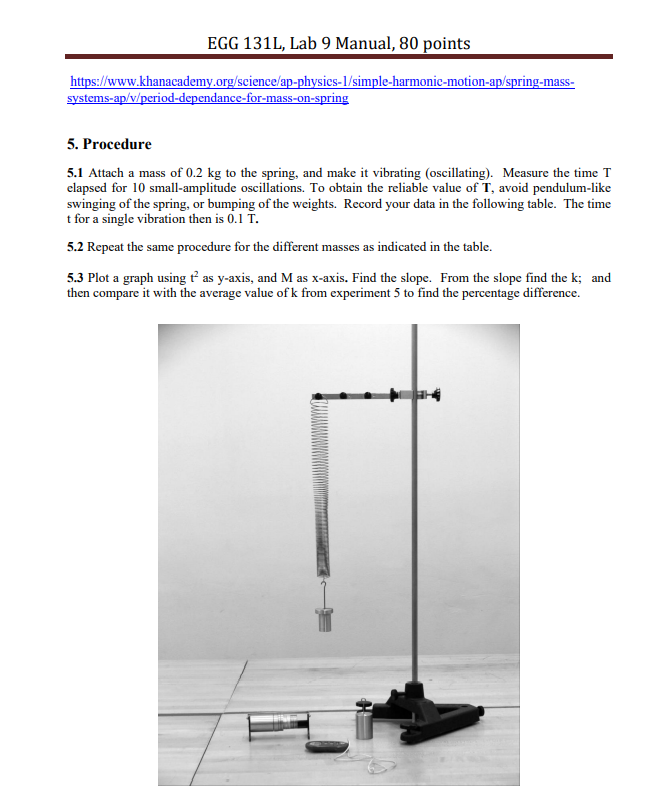
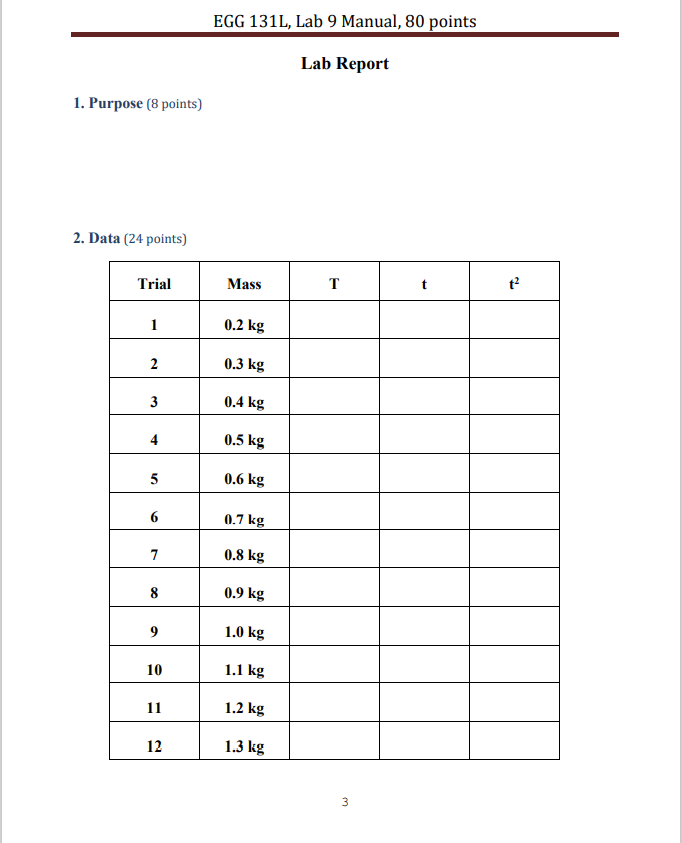

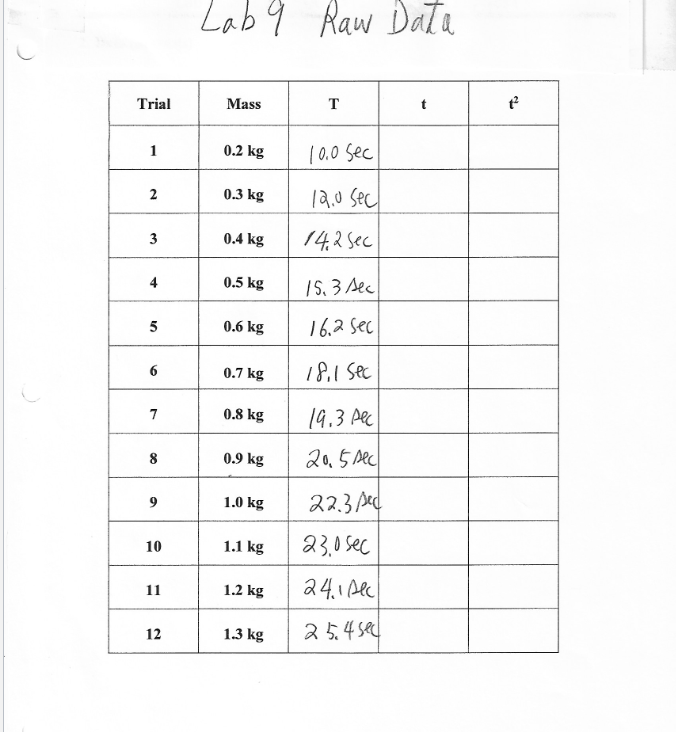
EGG 131L, Lab 9 Manual, 80 points Simple Harmonic Motion Name: 1. Objective Study oscillatory motion of a mass suspended by a spiral spring. 2. Apparatus Spring, supporting rod, clamp, stopwatch, and a set of slotted weights. 3. Theory A mass suspended by a light spring will execute vibrations if its restoring force opposes its displacement from an equilibrium position. This kind vibration is an example of simple harmonic motion. A more sophisticated study of this motion reveals: t = 2 n where t is the period of the vibration, M is the suspended mass, and k is the spring constant. This equation expresses the relation between the vibration period of the spring and the amount of mass attached to the spring. By squaring both sides of the equation one can get: t' = (4x-/k) M Let to be y, M be x, and (4x-/k) be m, then the above equation becomes y = mx, that is in form of the equation of a straight line, where m is the slope. By plotting the graph, the slope can be obtained, and then the spring constant k can be found. 4. Preparation 4.1 Read the following article to get some idea about a simple pendulum https://en.wikipedia.org/wiki/Oscillation https://www.khanacademy.org/science/ap-physics-1/simple-harmonic-motion-ap/spring-mass-systems- up/a/simple-harmonic-motion-of-spring-mass-systems-ap 4.2 Watch the following videos to see a demonstration for this lab. https://www.youtube.com/watch?v=FJBPNJR2QJU 1EGG 131L, Lab 9 Manual, 80 points https://www.khanacademy.org/science/ap-physics-1/simple-harmonic-motion-ap/spring-mass- systems-ap/v/period-dependance-for-mass-on-spring 5. Procedure 5.1 Attach a mass of 0.2 kg to the spring, and make it vibrating (oscillating). Measure the time T clapsed for 10 small-amplitude oscillations. To obtain the reliable value of T, avoid pendulum-like swinging of the spring, or bumping of the weights. Record your data in the following table. The time t for a single vibration then is 0.1 T. 5.2 Repeat the same procedure for the different masses as indicated in the table. 5.3 Plot a graph using t' as y-axis, and M as x-axis. Find the slope. From the slope find the k; and then compare it with the average value of k from experiment 5 to find the percentage difference.EGG 131L, Lab 9 Manual, 80 points Lab Report 1. Purpose (8 points) 2. Data (24 points) Trial Mass T t 12 0.2 kg 0.3 kg 3 0.4 kg 0.5 kg 0.6 kg 6 1.7 kg 0.8 kg 8 0.9 kg 9 1.0 kg 10 1.1 kg 11 1.2 kg 12 1.3 kg 3EGG 131L, Lab 9 Manual, 80 points 2. Graph (28 points)Lab 9 Raw Data Trial Mass T 12 0.2 kg 10.0 Sec 2 0.3 kg 12.0 Sec 0.4 kg 142 sec 0.5 kg 15. 3 Aec 0.6 kg 16.2 Sec 6 0.7 kg 18, 1 Sec 0.8 kg 19.3 pec 0.9 kg 20. 5 Dec 1.0 kg 22.3 ped 10 1.1 kg 23.0 sec 11 1.2 kg 24. 1 Alc 12 1.3 kg 2 5. 4 sex
Step by Step Solution
There are 3 Steps involved in it

Get step-by-step solutions from verified subject matter experts