

Question: Can you please help me interpret what these 3 statistical output results mean? I need it to be detailed ! Thank you so much !!!
Can you please help me interpret what these 3 statistical output results mean? I need it to be detailed ! Thank you so much !!!
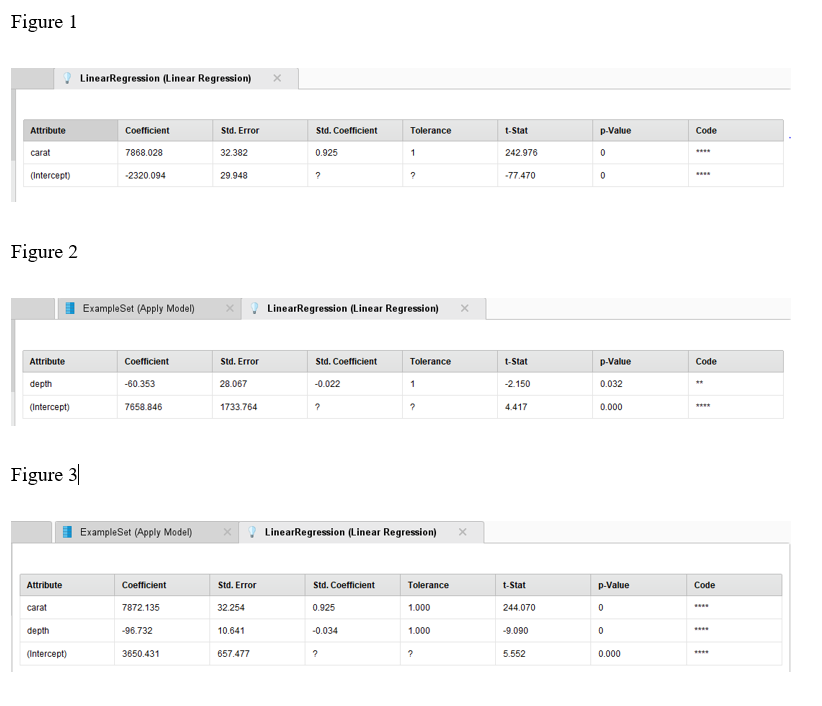
Figure 1 LinearRegression (Linear Regression) X Attribute Coefficient Sid. Error Std. Coefficient Tolerance 1-Stat p-Value Code 7868.028 32.382 0.925 242.976 0 29.948 -77.470 (Intercept) 2320.094 Figure 2 ExampleSet (Apply Model) X LinearRegression (Linear Regression) X Coefficient Tolerance -Stat p-Value Code Attribute Sid. Error Sid. Coefficient depth -60.353 28.067 -0.022 -2.150 0.032 1733.764 4.417 0.000 (Intercept) 7658 846 Figure 3 ExampleSet (Apply Model) X LinearRegression (Linear Regression) X Std. Error Tolerance t-Stat p-Value Attribute Coefficient Std. Coefficient Code carat 7872.135 32.254 0.925 1.000 244.070 depth -96.732 10.641 -0.034 1.000 -9.090 (Intercept) 3650.431 657.477 5.552 0.000
Step by Step Solution
There are 3 Steps involved in it

Get step-by-step solutions from verified subject matter experts