

Question: Can you please help me solve a) on this practise exam? I don't know much about linear regression. QNT565 - QUANTITATIVE ANALYSIS - SEMESTER 1,
Can you please help me solve a) on this practise exam? I don't know much about linear regression.
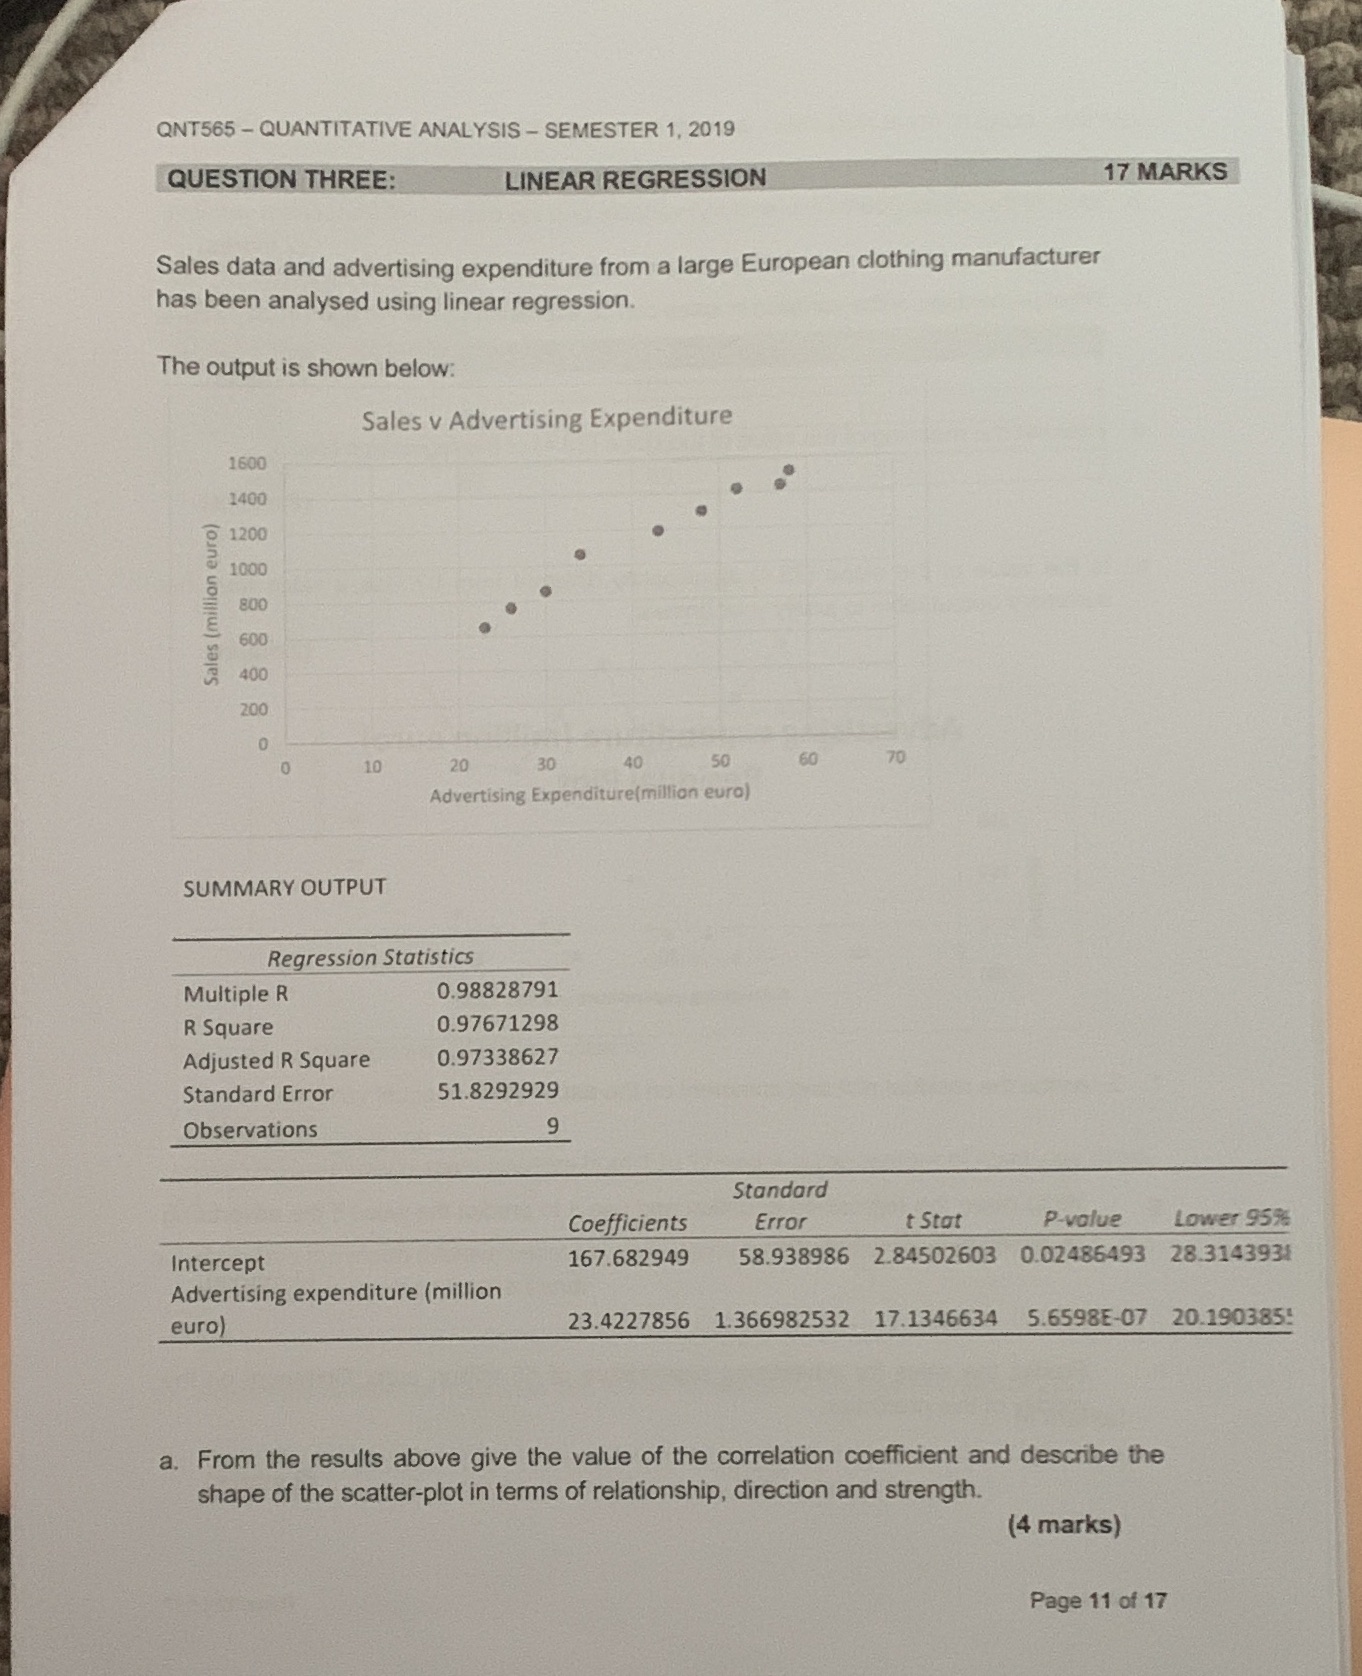
QNT565 - QUANTITATIVE ANALYSIS - SEMESTER 1, 2019 QUESTION THREE: LINEAR REGRESSION 17 MARKS Sales data and advertising expenditure from a large European clothing manufacturer has been analysed using linear regression. The output is shown below: Sales v Advertising Expenditure 1600 1400 2 1200 1000 800 Sales (million 600 400 200 0 10 20 30 40 50 60 70 Advertising Expenditure(million euro) SUMMARY OUTPUT Regression Statistics Multiple R 0.98828791 R Square 0.97671298 Adjusted R Square 0.97338627 Standard Error 51.8292929 Observations Standard Coefficients Error t Stat P-value Lower 95%% Intercept 167.682949 58.938986 2.84502603 0.02486493 28.3143931 Advertising expenditure (million euro) 23.4227856 1.366982532 17.1346634 5.6598E-07 20.190385! a. From the results above give the value of the correlation coefficient and describe the shape of the scatter-plot in terms of relationship, direction and strength. (4 marks) Page 11 of 17
Step by Step Solution
There are 3 Steps involved in it

Get step-by-step solutions from verified subject matter experts