

Question: Can you please help me with my statistics problem? Histogram A QQ plot 1 0.8 Sample Quantiles Frequency 1.0 0.2 0.6 0.8 Theoretical Quantiles Histogram
Can you please help me with my statistics problem?
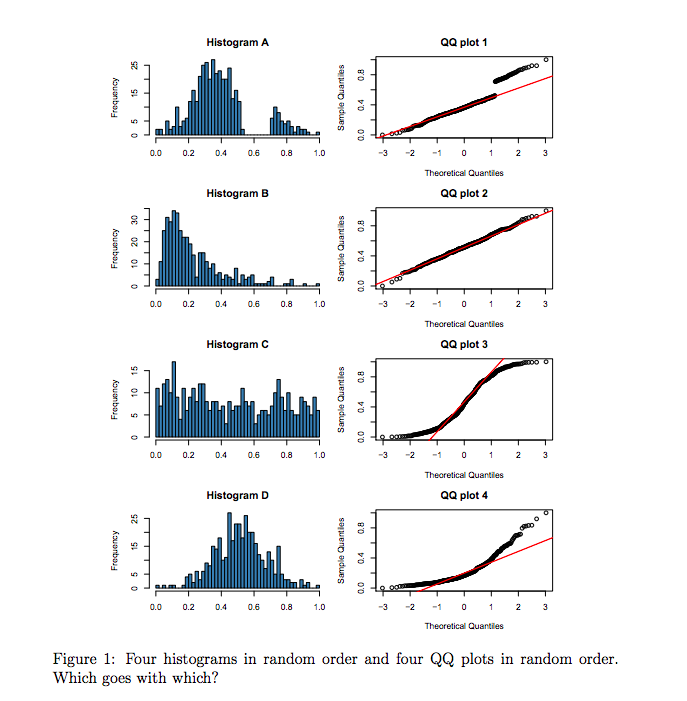
Histogram A QQ plot 1 0.8 Sample Quantiles Frequency 1.0 0.2 0.6 0.8 Theoretical Quantiles Histogram B QQ plot 2 0.8 Frequency Sample Quantiles 0.4 0.2 0.4 0.8 Theoretical O al Quantiles Histogram C QQ plot 3 0.8 Sample Quanties fouan bay 1.0 0.2 0.4 0.6 0.8 Theoretical Quantiles Histogram D QQ plot 4 0.8 Sample Quanties Frequency Lo Ook 0.2 0.4 0.6 0.8 Theoretical Quantiles Figure 1: Four histograms in random order and four QQ plots in random order. Which goes with which
Step by Step Solution
There are 3 Steps involved in it
1 Expert Approved Answer
Step: 1 Unlock

Question Has Been Solved by an Expert!
Get step-by-step solutions from verified subject matter experts
Step: 2 Unlock
Step: 3 Unlock