

Question: Can you please help me with this. 2. 7 The following graph shows the demand and supply for grape market. 5 4.5 4 3.5 o
Can you please help me with this.
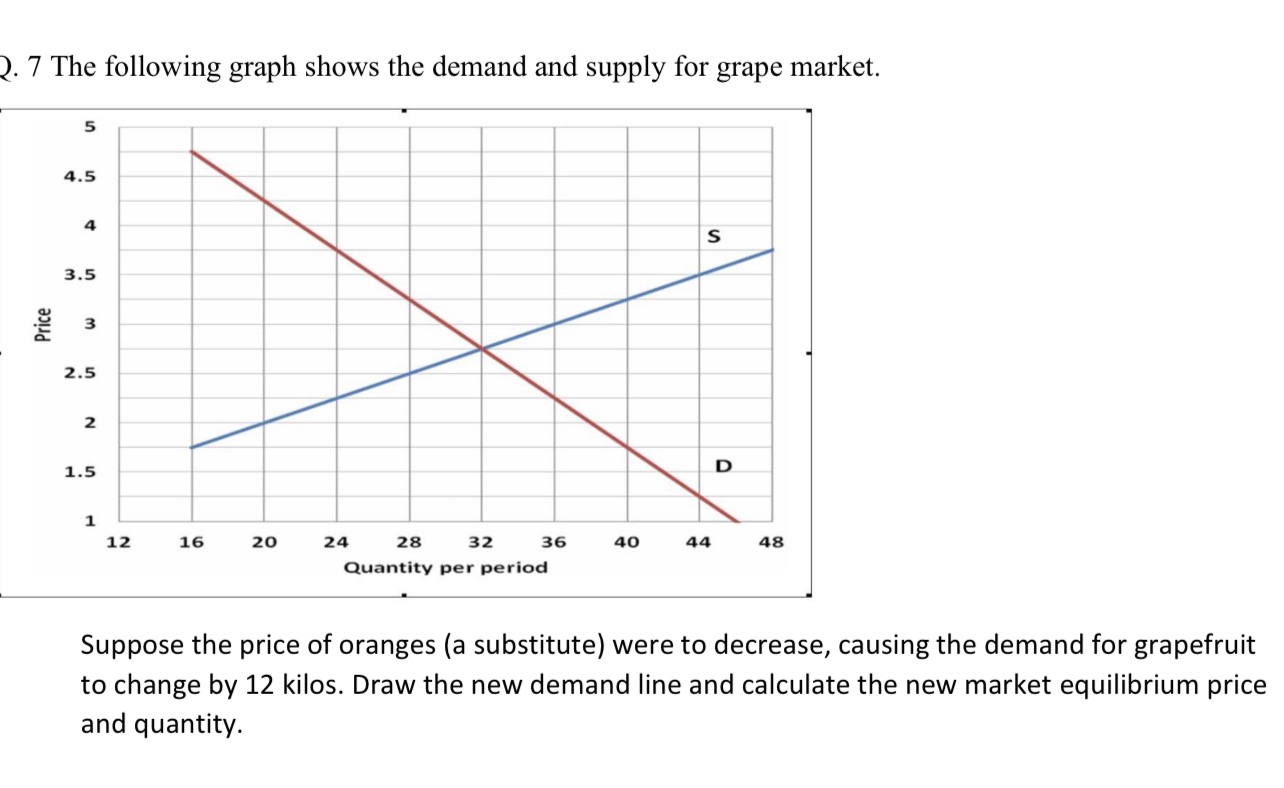
2. 7 The following graph shows the demand and supply for grape market. 5 4.5 4 3.5 o .5 3 D. 2.5 2 1.5 2|. 12 16 20 24 28 32 35 4D 44 48 Quantity per period Suppose the price of oranges (a substitute) were to decrease, causing the demand for grapefruit to change by 12 kilos. Draw the new demand line and calculate the new market equilibrium price and quantity
Step by Step Solution
There are 3 Steps involved in it
1 Expert Approved Answer
Step: 1 Unlock

Question Has Been Solved by an Expert!
Get step-by-step solutions from verified subject matter experts
Step: 2 Unlock
Step: 3 Unlock