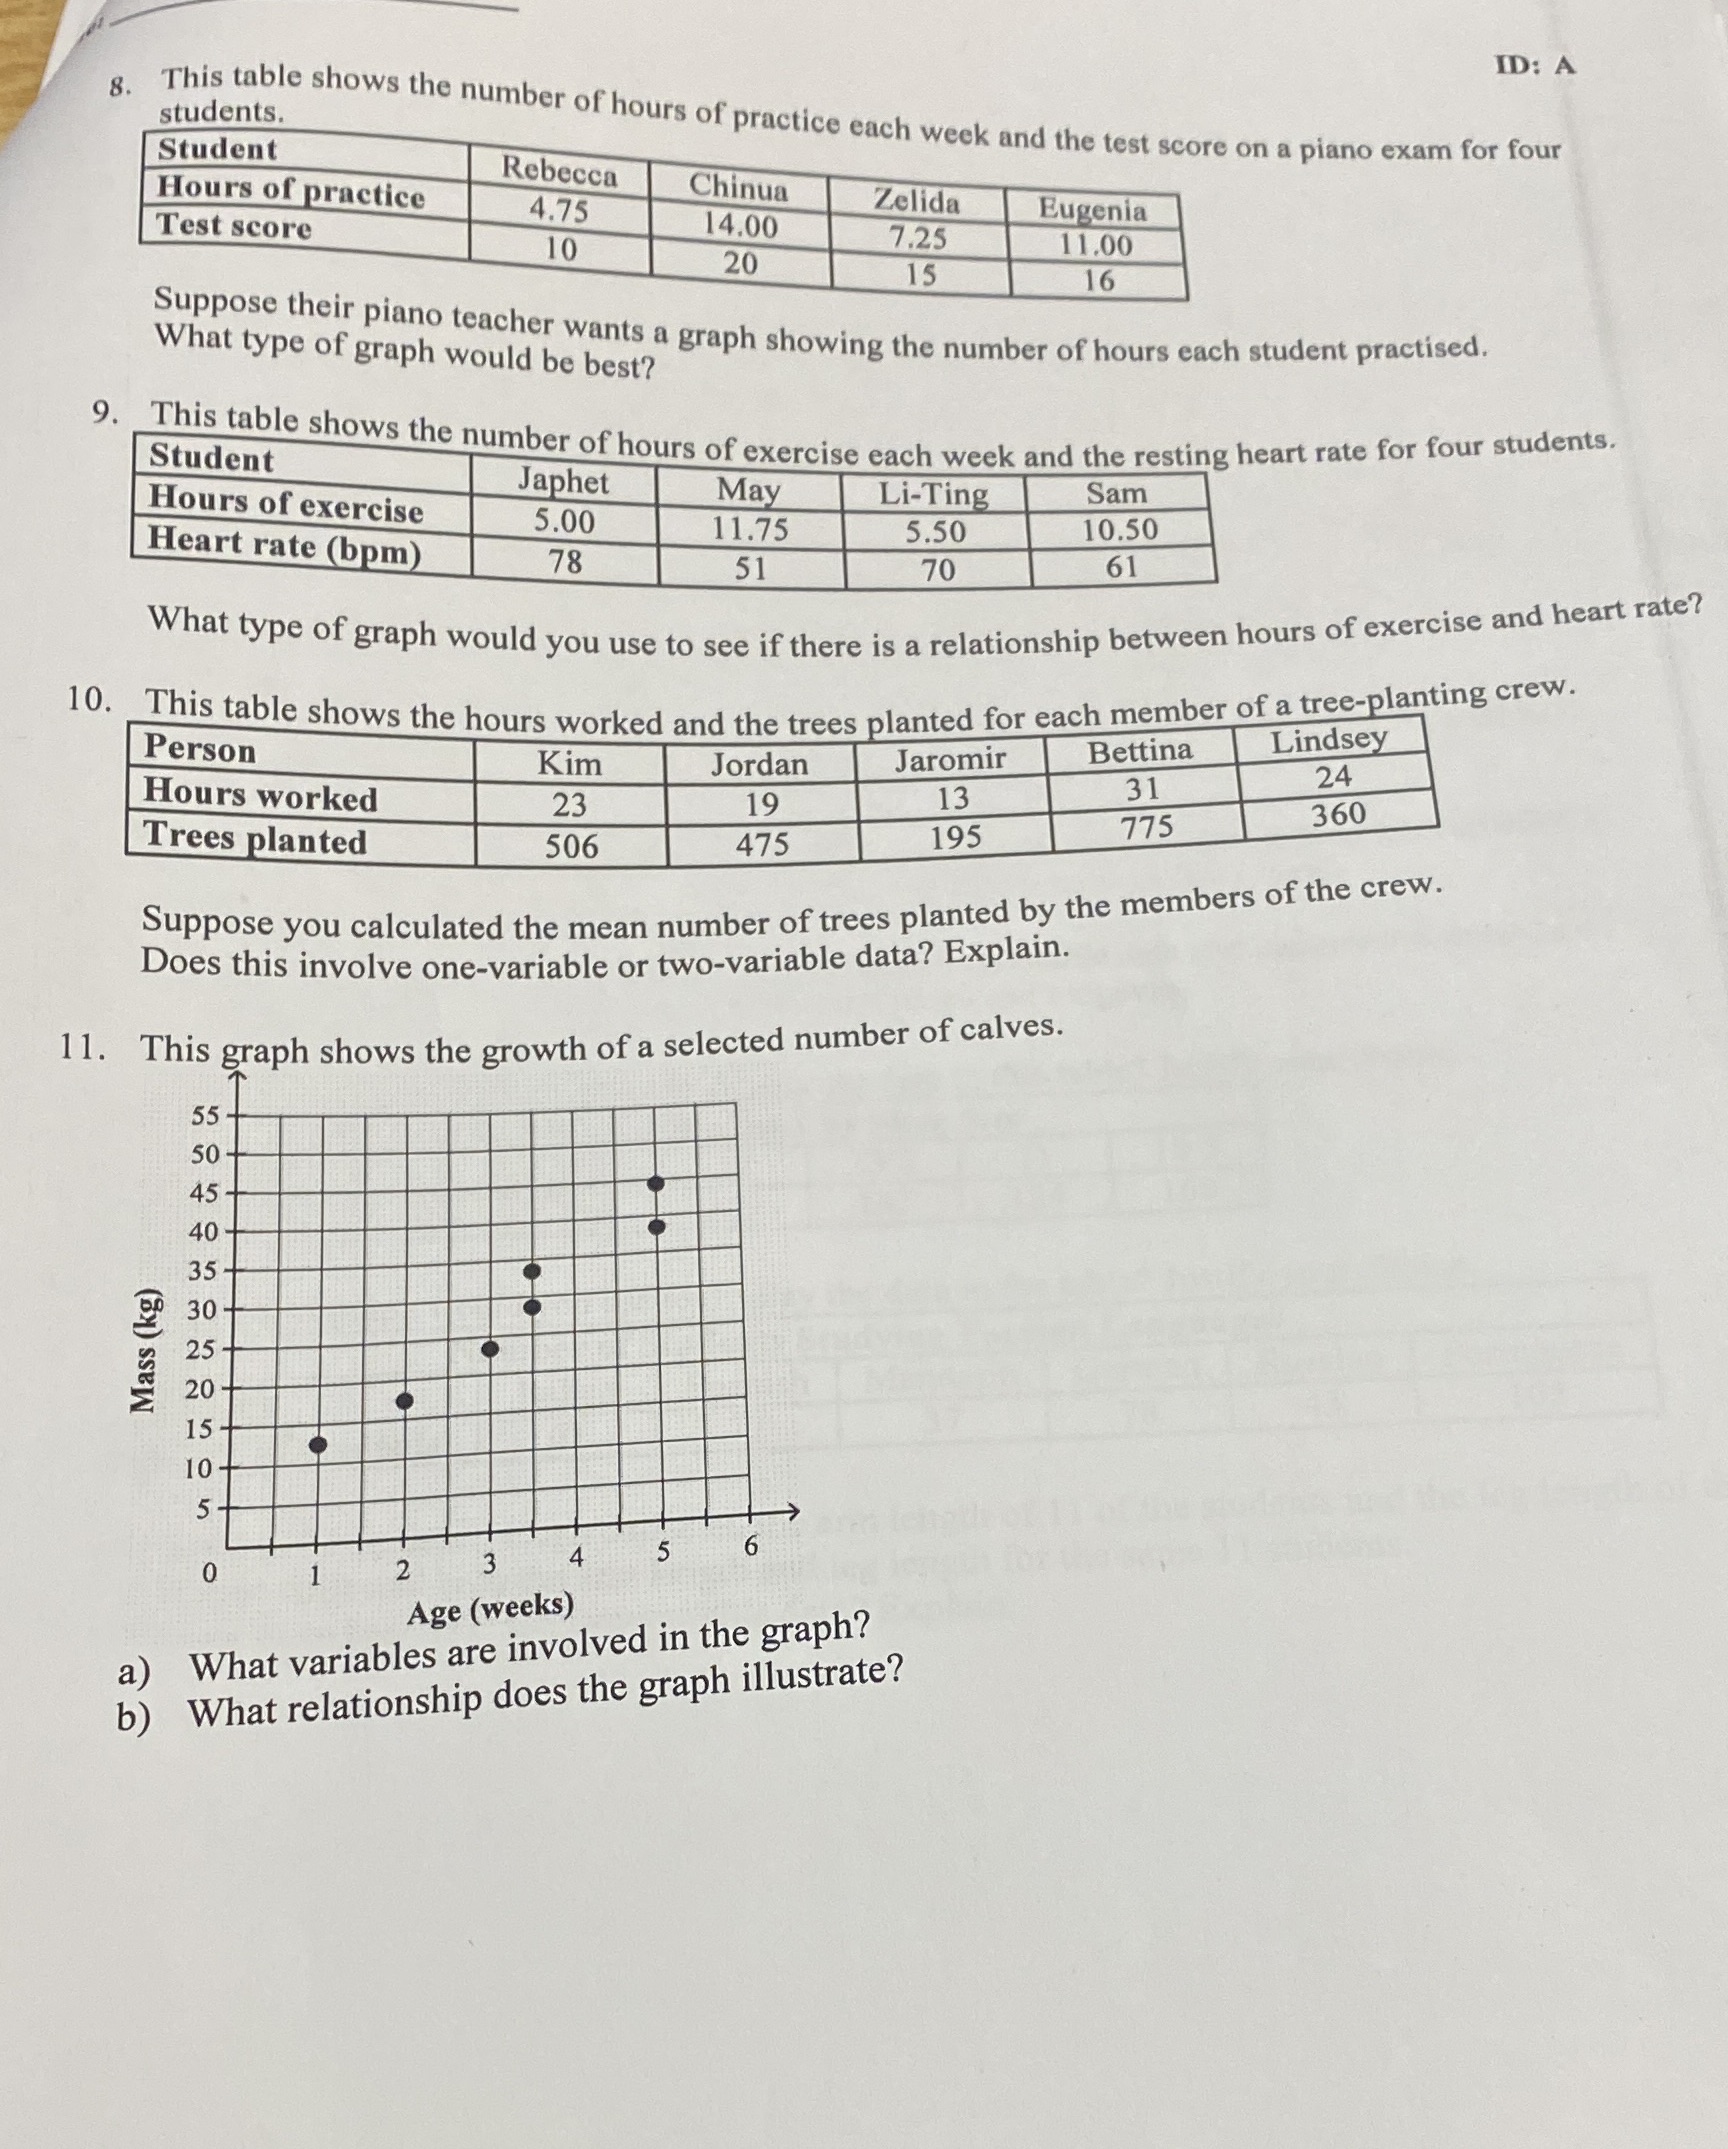
Question: Can you please help me with this assignment for math. It's data management. Please and thanks 8. ID: A students. This table shows the number

Can you please help me with this assignment for math. It's data management. Please and thanks

Can you please help me with this assignment for
8. ID: A students. This table shows the number of hours of practice each week and the test score on a piano exam for four Student Hours of practice Rebecca Chinua 4.75 Zelida Test score 14.00 Eugenia 10 7.25 20 11.00 15 16 Suppose their piano teacher wants a graph showing the number of hours each student practised. What type of graph would be best? Student 9. This table shows the number of hours of exercise each week and the resting heart rate for four students. Hours of exercise Japhet May Li-Ting Sam 5.00 Heart rate (bom 11.75 5.50 10.50 78 51 70 61 What type of graph would you use to see if there is a relationship between hours of exercise and heart rate? 10. This table shows the hours worked and the trees planted for each member of a tree-planting crew. Person Kim Jaromir Bettina Lindsey Jordan Hours worked 31 24 23 19 13 Trees planted 360 506 475 195 775 Suppose you calculated the mean number of trees planted by the members of the crew. Does this involve one-variable or two-variable data? Explain. 1 1. This graph shows the growth of a selected number of calves. 55 50 45 40 35 30 Mass (kg 25 20 15 10 O Age (weeks) What variables are involved in the graph? What relationship does the graph illustrate

Step by Step Solution

There are 3 Steps involved in it

1 Expert Approved Answer
Step: 1 Unlock blur-text-image
Question Has Been Solved by an Expert!

Get step-by-step solutions from verified subject matter experts

Step: 2 Unlock
Step: 3 Unlock

Students Have Also Explored These Related Mathematics Questions!