

Question: Please help me with this assignment 1. What is the definition of a cause? a) The result of what happened in a given situation. b)
Please help me with this assignment
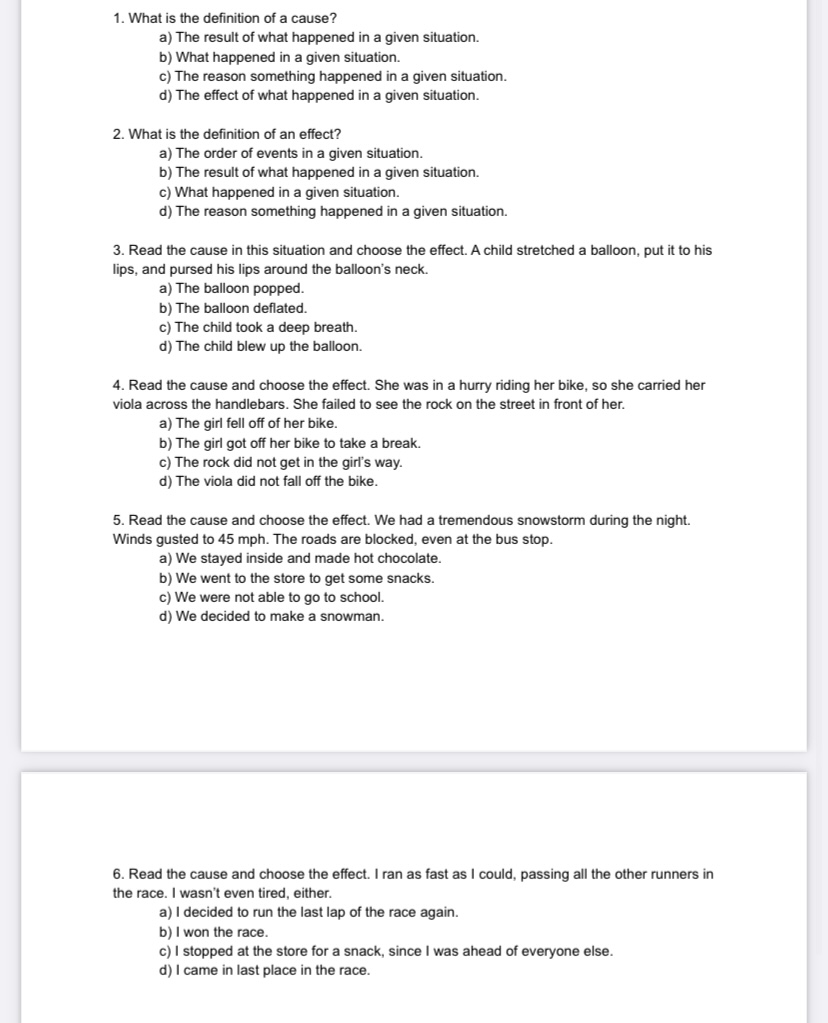
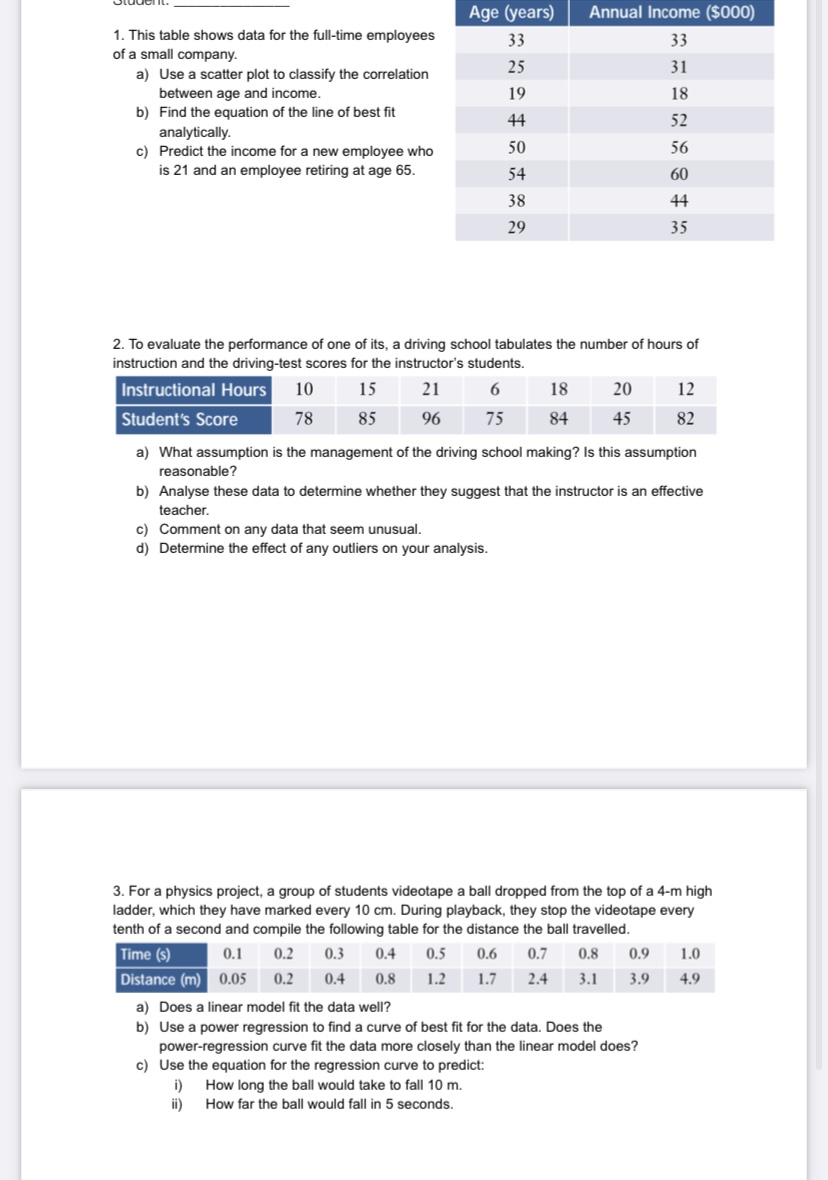
1. What is the definition of a cause? a) The result of what happened in a given situation. b) What happened in a given situation. c) The reason something happened in a given situation. d) The effect of what happened in a given situation. 2. What is the definition of an effect? a) The order of events in a given situation. b) The result of what happened in a given situation. c) What happened in a given situation. d) The reason something happened in a given situation. 3. Read the cause in this situation and choose the effect. A child stretched a balloon, put it to his lips, and pursed his lips around the balloon's neck. a) The balloon popped. b) The balloon deflated. c) The child took a deep breath. d) The child blew up the balloon. 4. Read the cause and choose the effect. She was in a hurry riding her bike, so she carried her viola across the handlebars. She failed to see the rock on the street in front of her. a) The girl fell off of her bike. b) The girl got off her bike to take a break. c) The rock did not get in the girl's way. d) The viola did not fall off the bike. 5. Read the cause and choose the effect. We had a tremendous snowstorm during the night. Winds gusted to 45 mph. The roads are blocked, even at the bus stop. a) We stayed inside and made hot chocolate. b) We went to the store to get some snacks. c) We were not able to go to school. d) We decided to make a snowman. 6. Read the cause and choose the effect. I ran as fast as I could, passing all the other runners in the race. I wasn't even tired, either. a) I decided to run the last lap of the race again. b) I won the race. c) I stopped at the store for a snack, since I was ahead of everyone else. d) I came in last place in the race.Age (years) Annual Income ($000) 1. This table shows data for the full-time employees 33 33 of a small company. 25 a) Use a scatter plot to classify the correlation 31 between age and income. 19 18 b) Find the equation of the line of best fit 44 52 analytically. c) Predict the income for a new employee who 50 56 is 21 and an employee retiring at age 65. 54 60 38 44 29 35 2. To evaluate the performance of one of its, a driving school tabulates the number of hours of instruction and the driving-test scores for the instructor's students. Instructional Hours 10 15 21 6 18 20 12 Student's Score 78 85 96 75 84 45 82 a) What assumption is the management of the driving school making? Is this assumption reasonable? b) Analyse these data to determine whether they suggest that the instructor is an effective teacher. c) Comment on any data that seem unusual. d) Determine the effect of any outliers on your analysis. 3. For a physics project, a group of students videotape a ball dropped from the top of a 4-m high ladder, which they have marked every 10 cm. During playback, they stop the videotape every tenth of a second and compile the following table for the distance the ball travelled. Time (s) 0.1 0.2 0.3 0.4 0.5 0.6 0.7 0.8 0.9 1.0 Distance (m) 0.05 0.2 0.4 0.8 1.2 1.7 2.4 3.1 3.9 4.9 a) Does a linear model fit the data well? b) Use a power regression to find a curve of best fit for the data. Does the power-regression curve fit the data more closely than the linear model does? c) Use the equation for the regression curve to predict: i) How long the ball would take to fall 10 m. ii) How far the ball would fall in 5 seconds
Step by Step Solution
There are 3 Steps involved in it

Get step-by-step solutions from verified subject matter experts