

Question: can you please help solve this assignment. I will pay you for each question. its for for stat class name mir calories protein fat sodium
can you please help solve this assignment. I will pay you for each question. its for for stat class
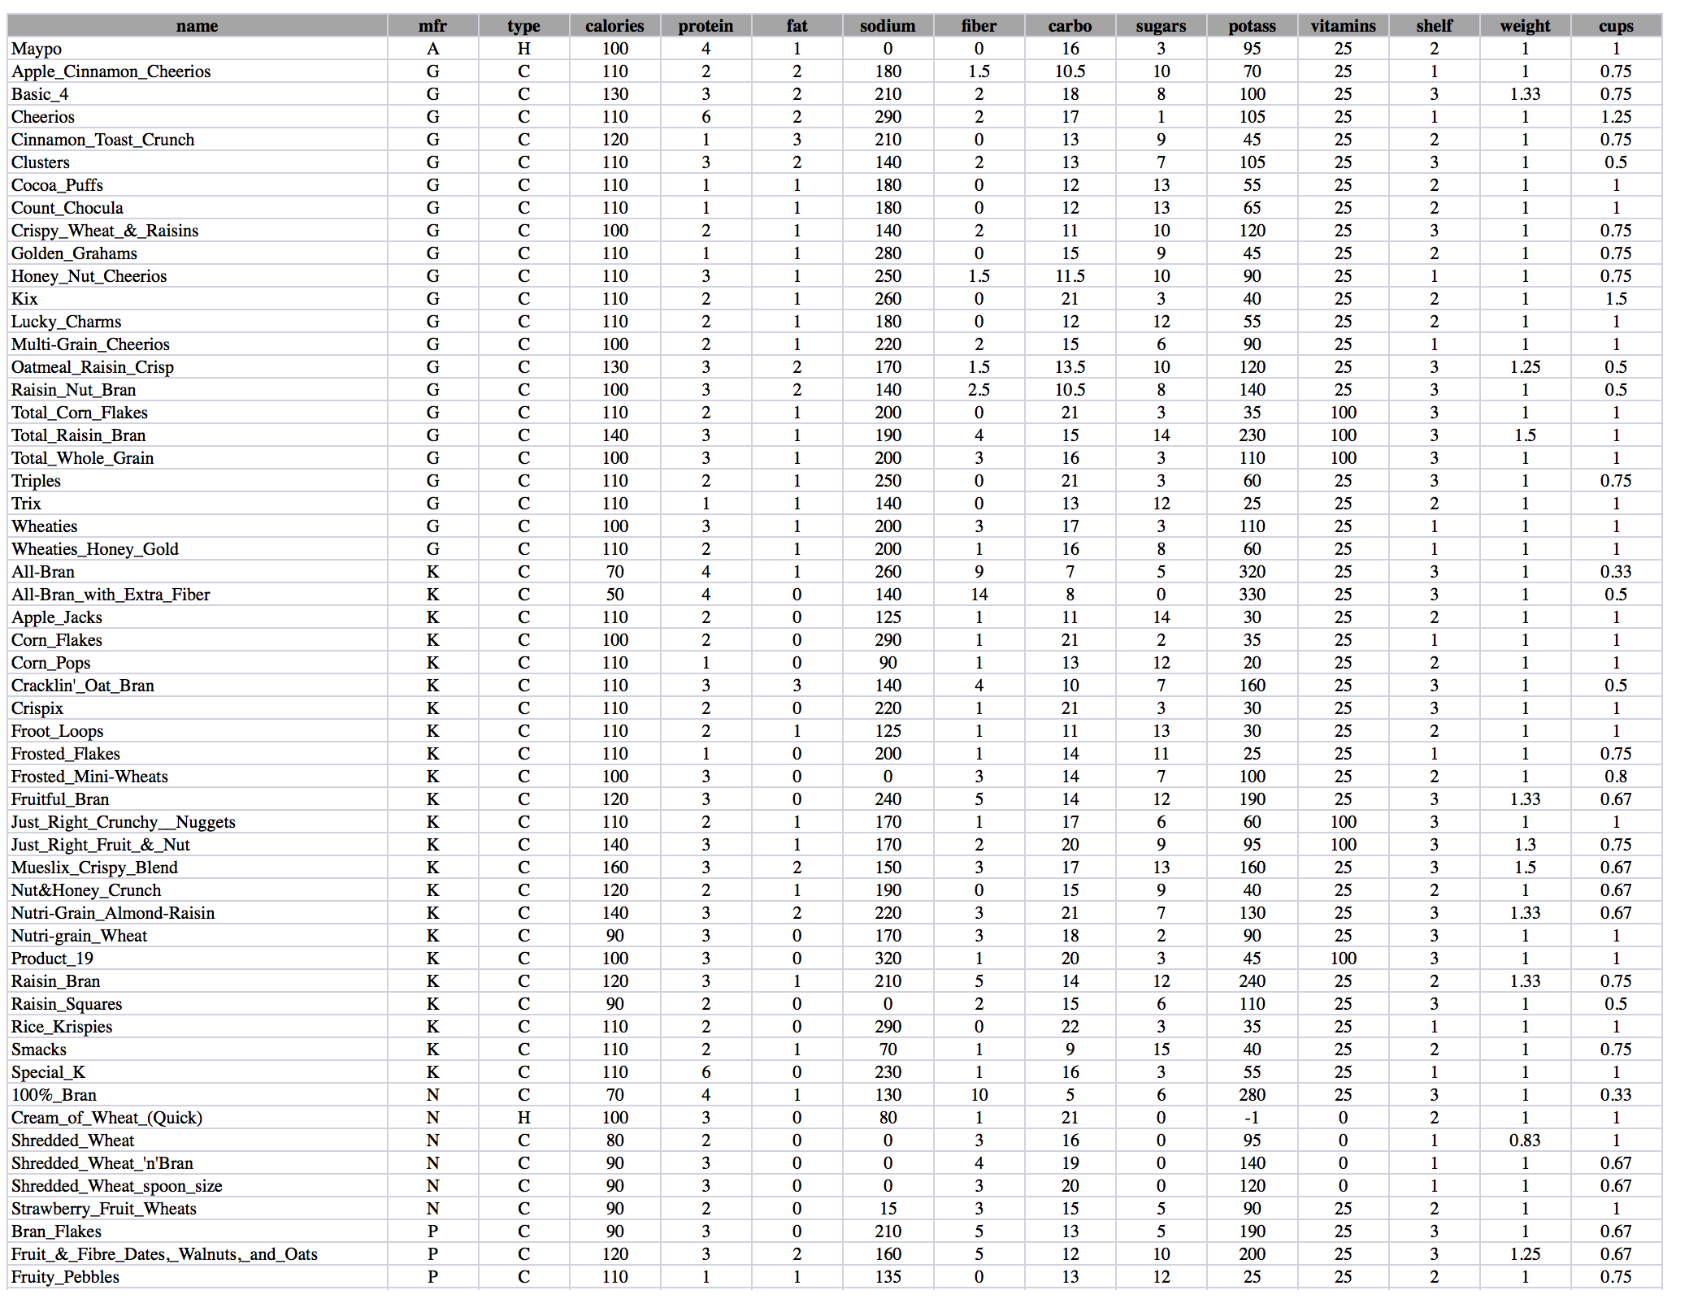
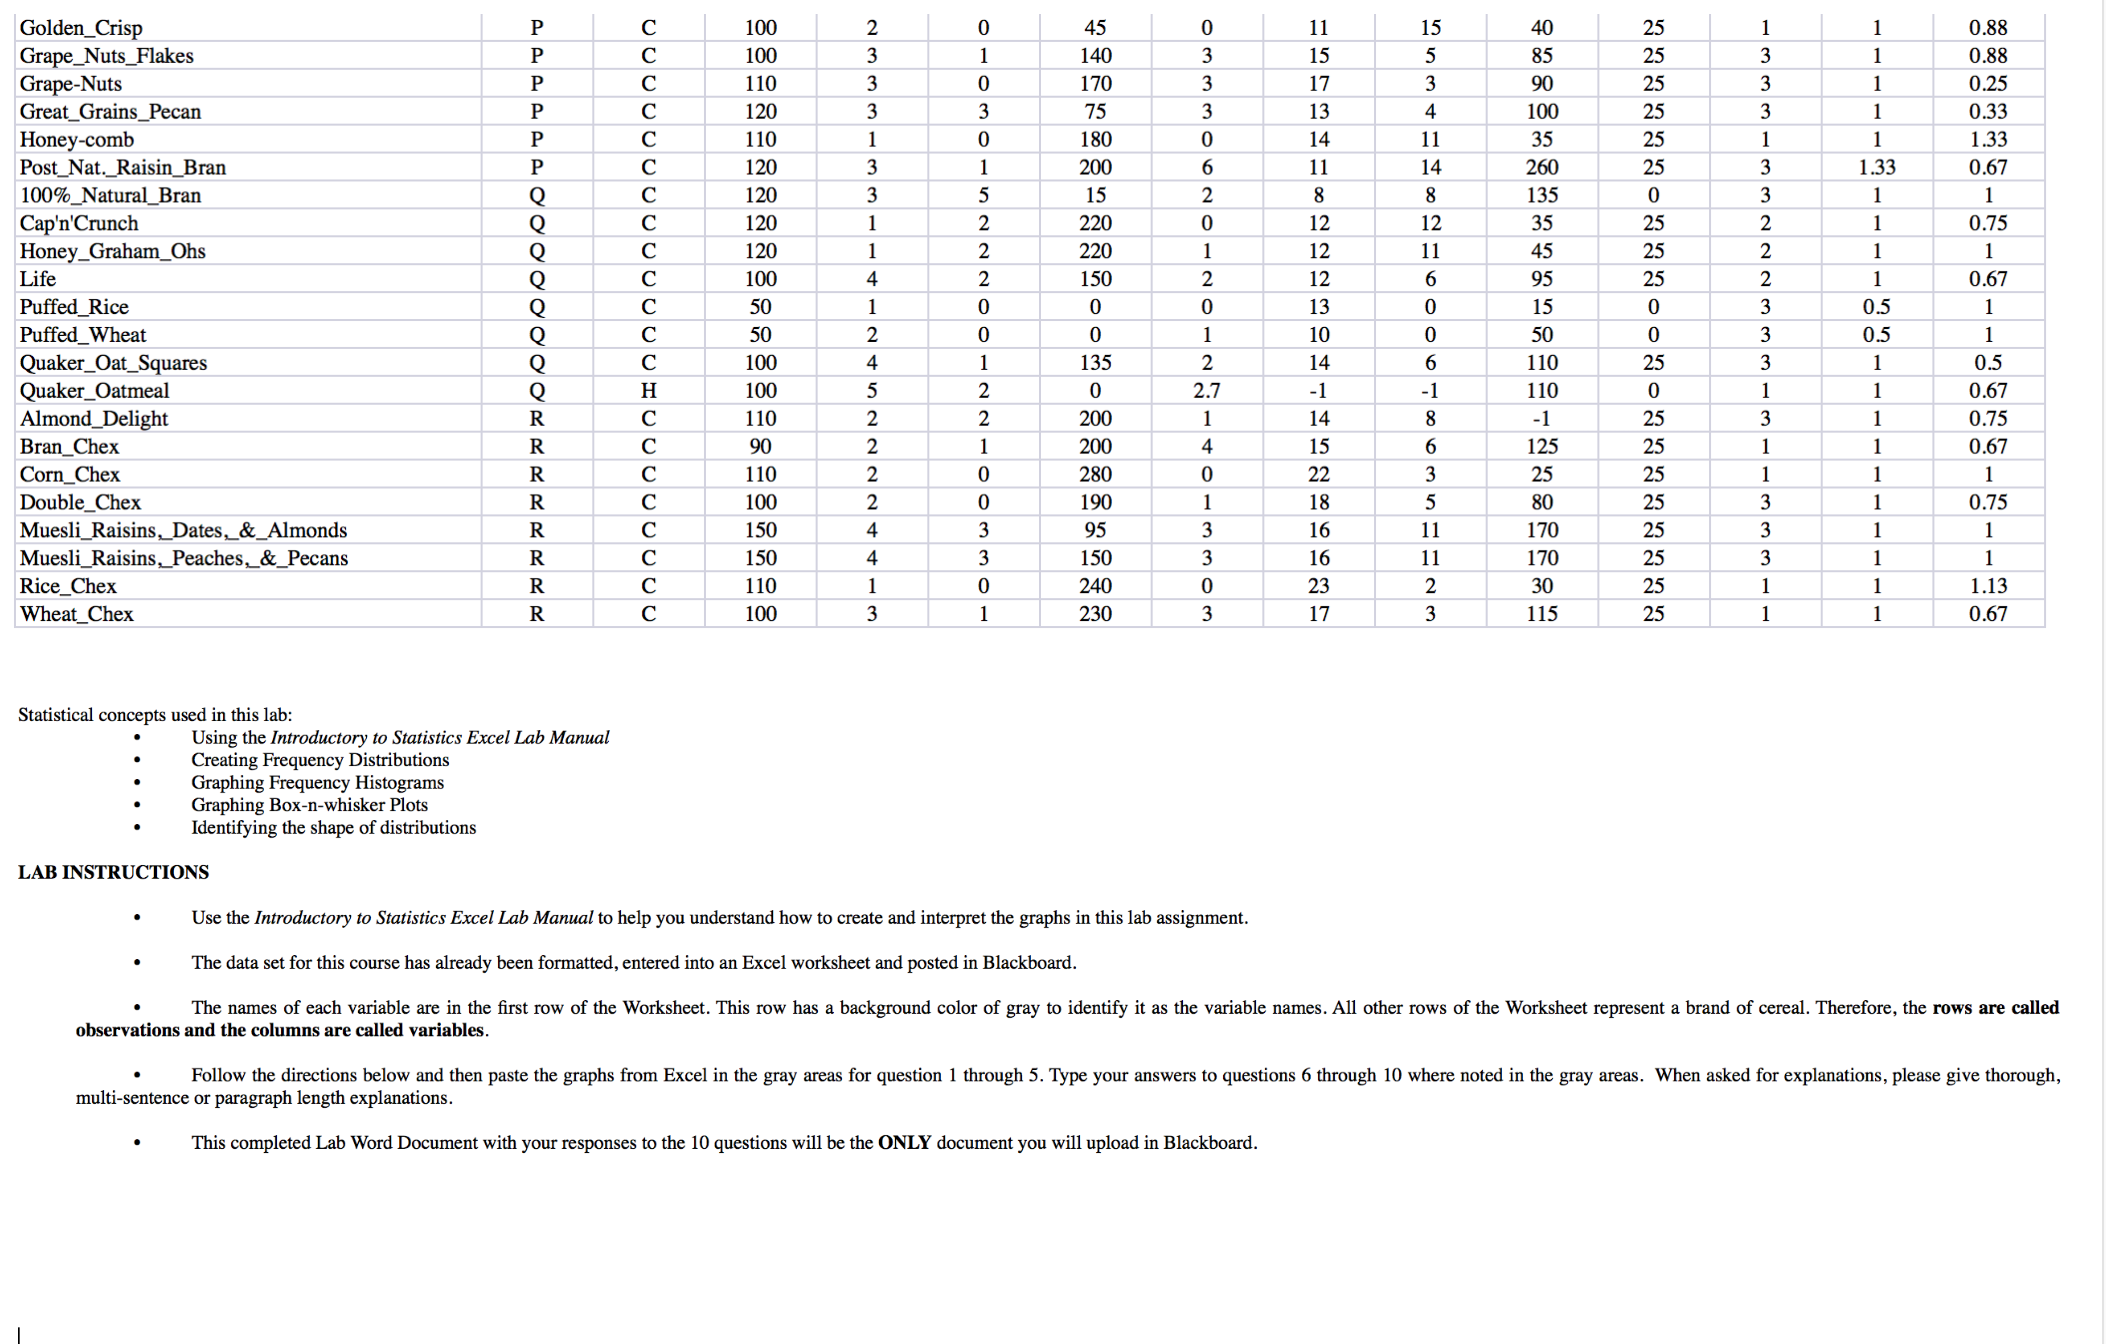
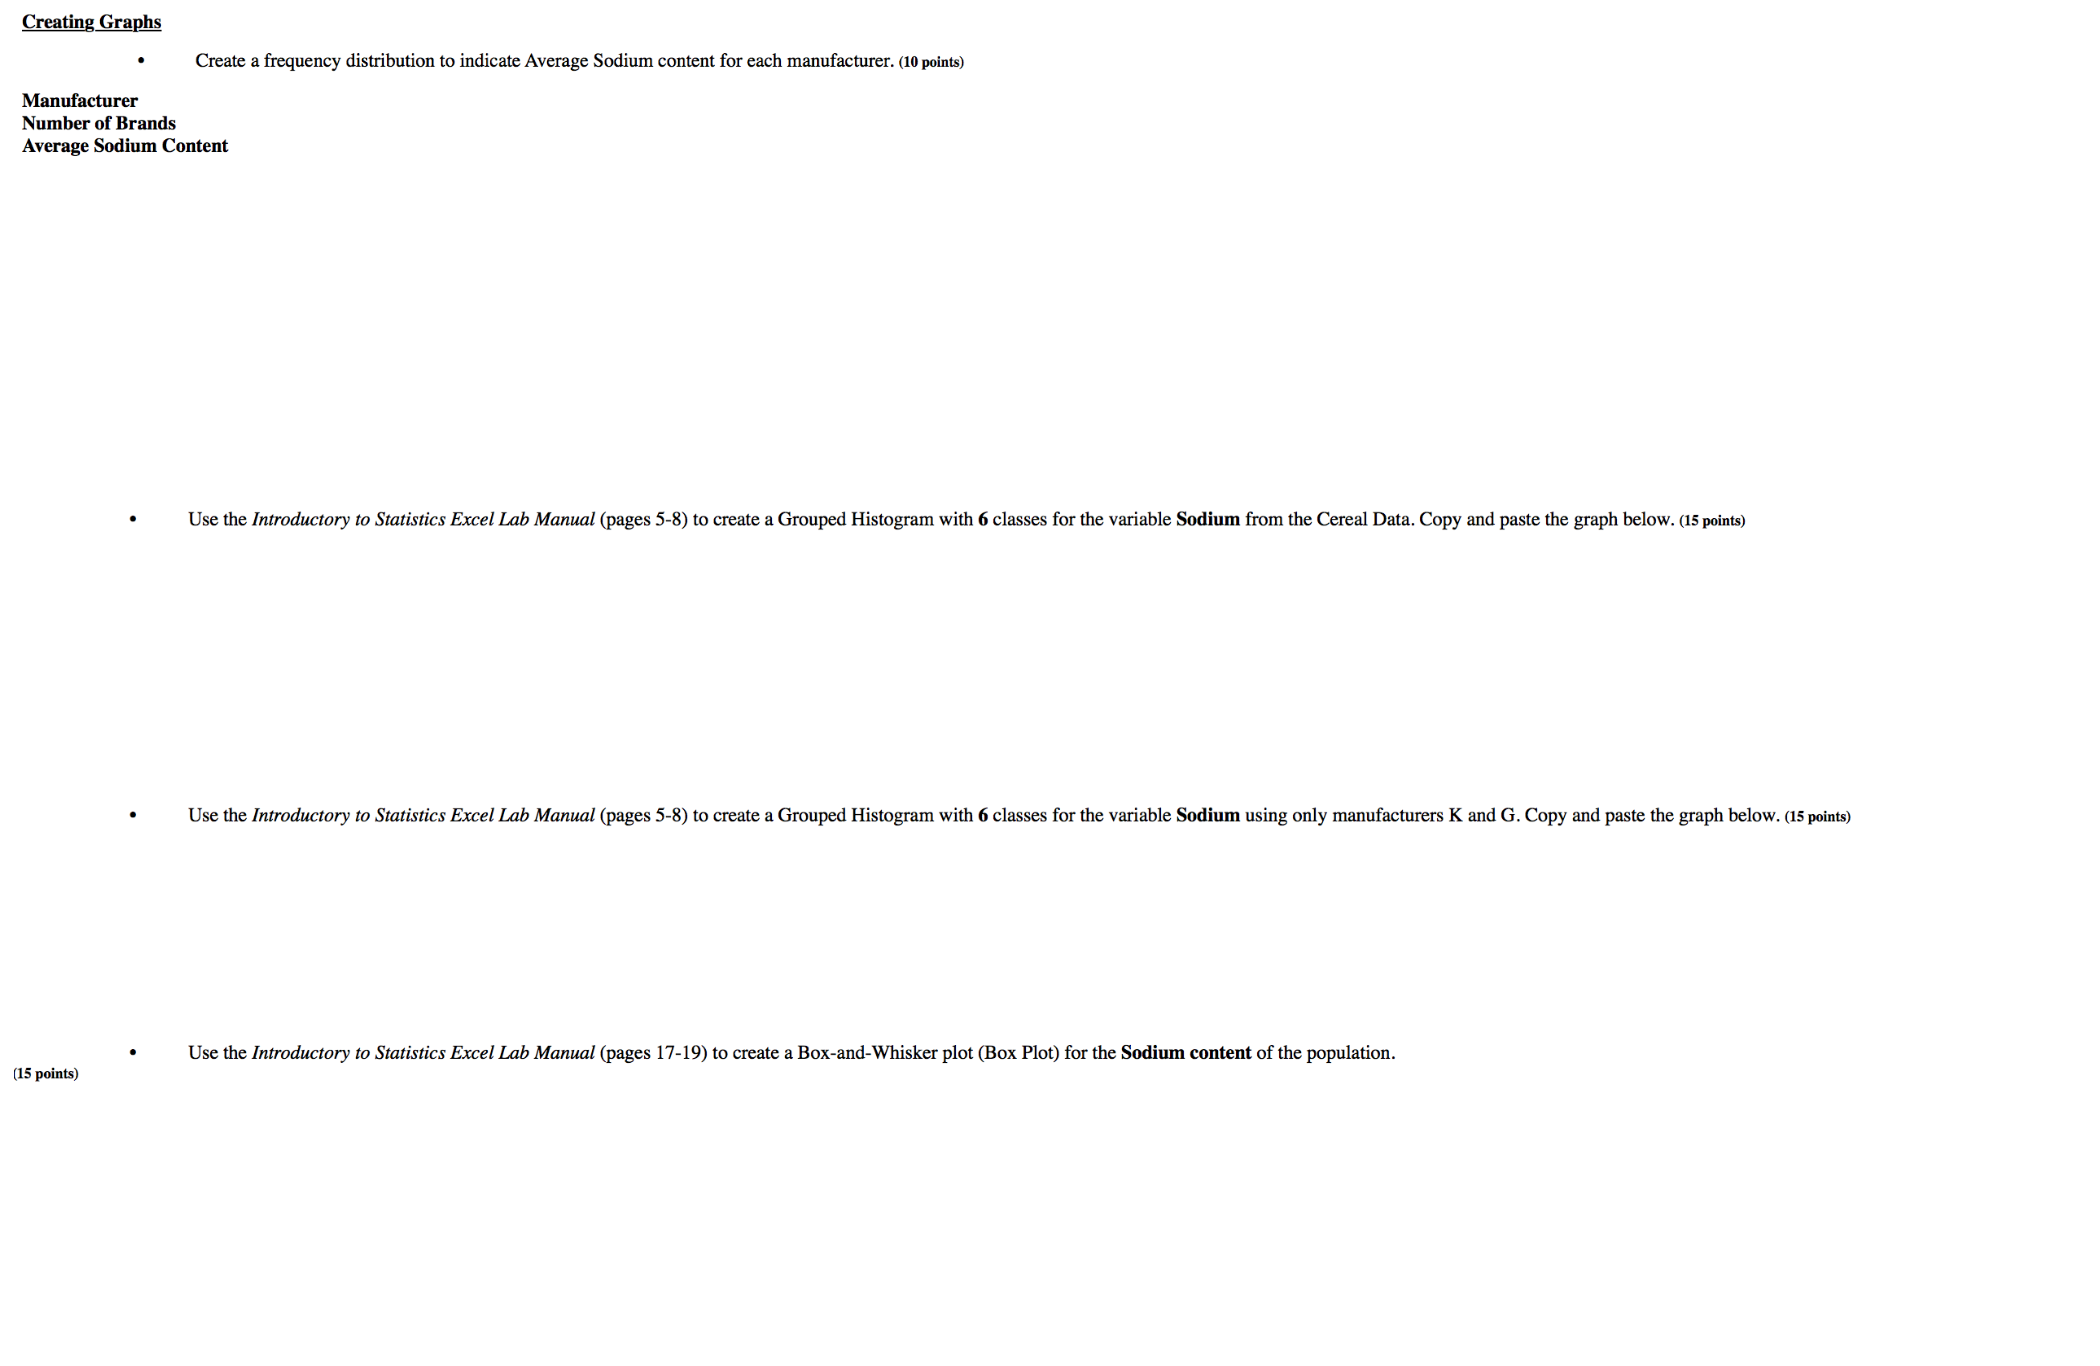
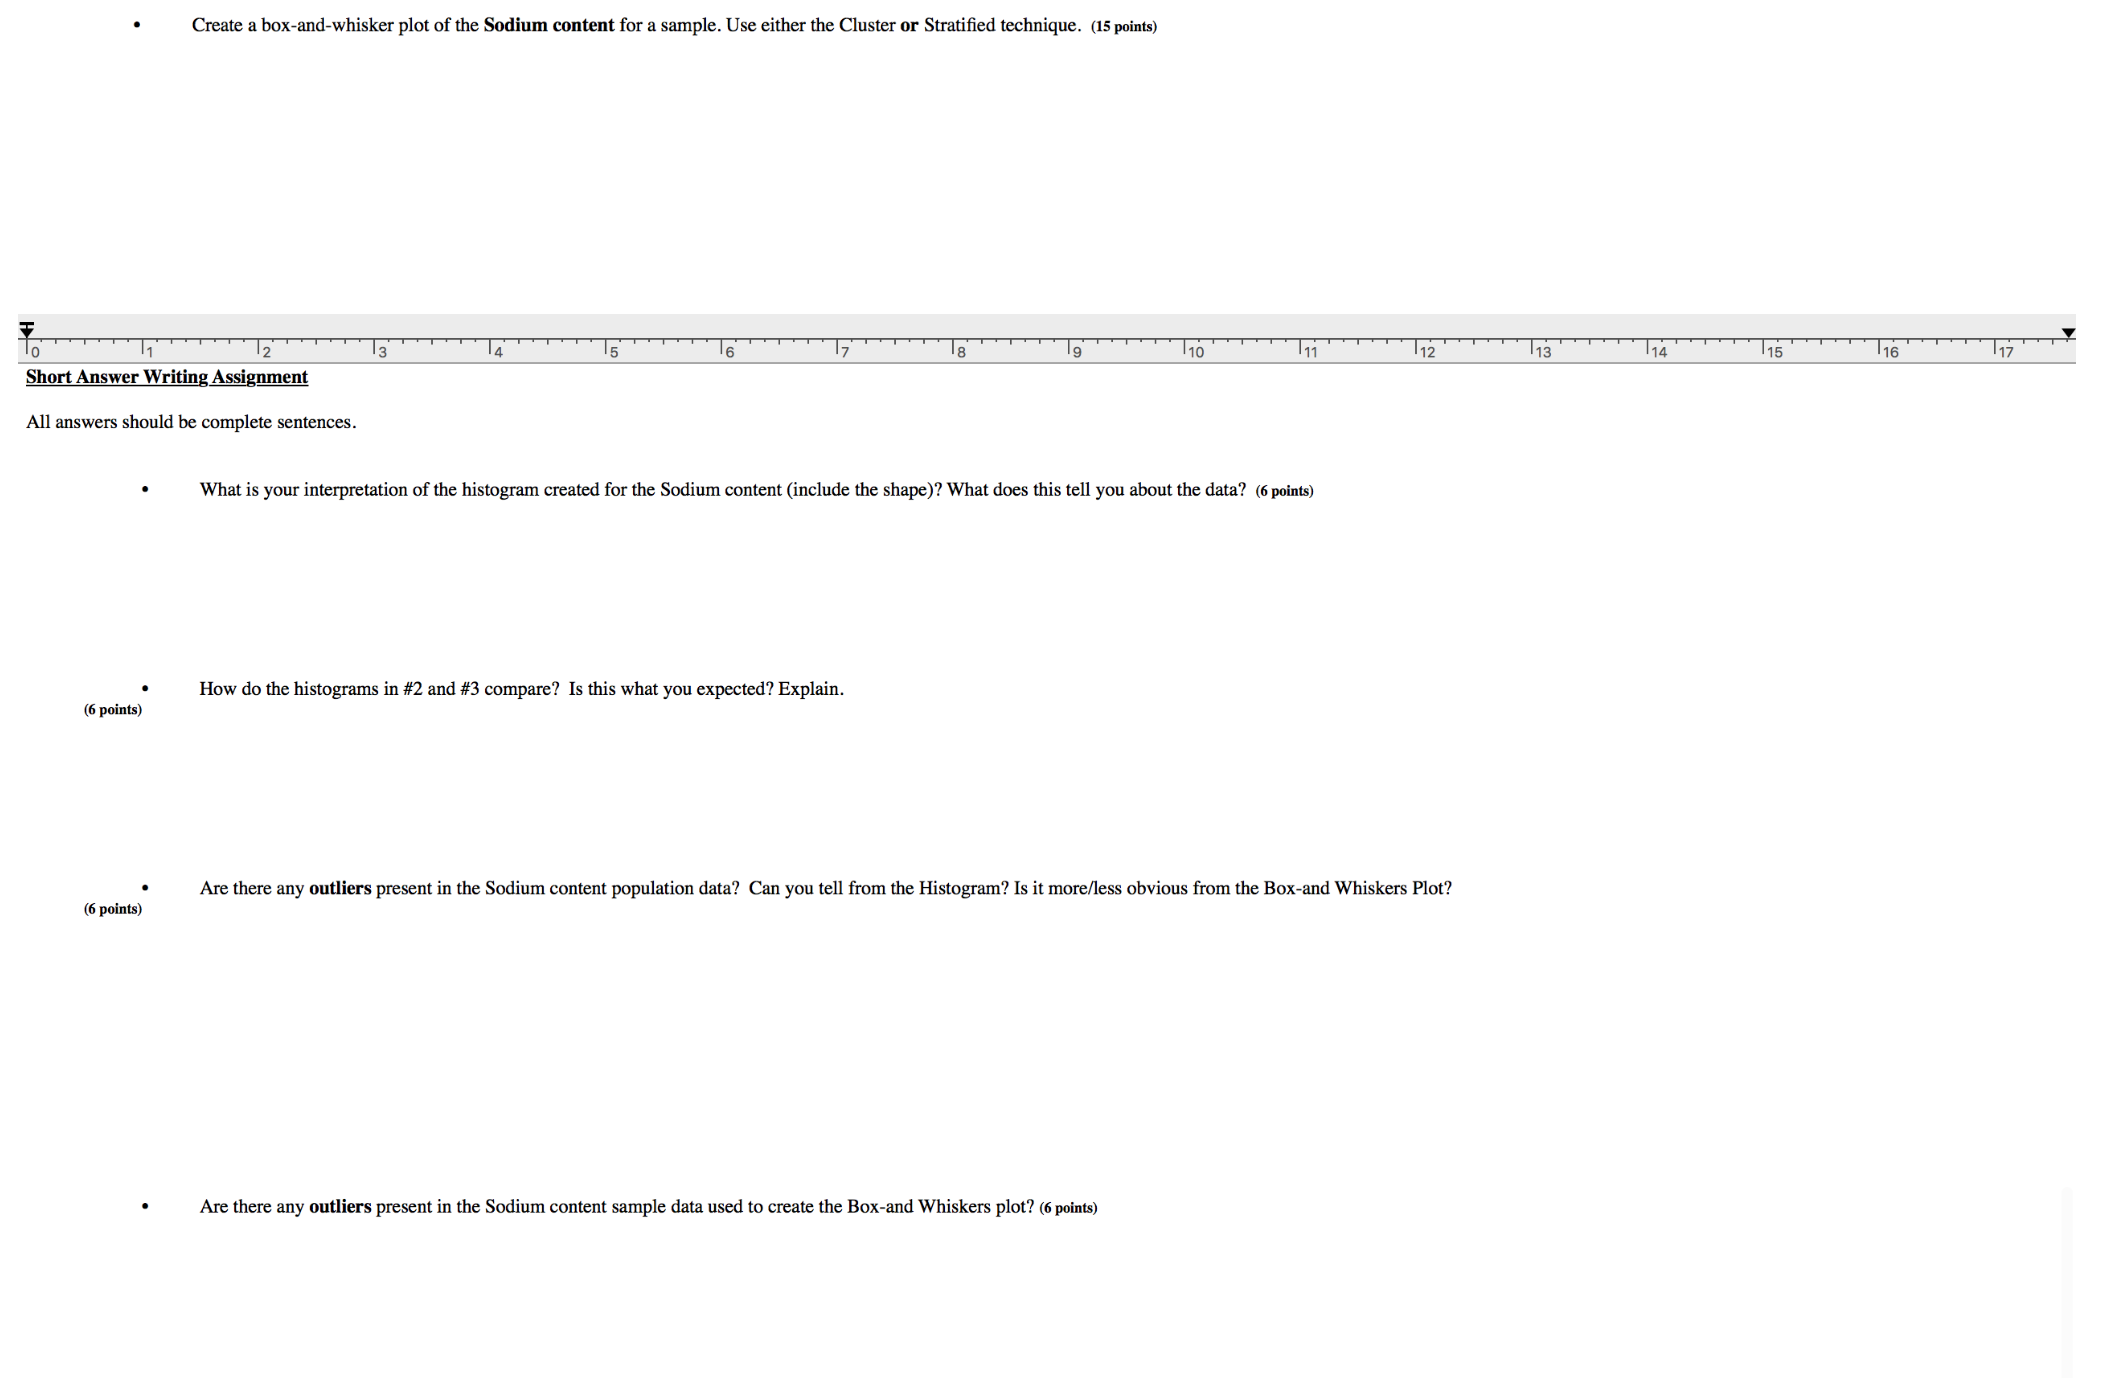
name mir calories protein fat sodium fiber carbo sugars potass vitamins shelf weight cups C 16 95 1 Maypo 100 Apple_Cinnamon_Cheerios - -NWNNN 180 10.5 0.75 Basic_4 21 18 1.33 0.75 17 1.25 Cheerios 290 210 13 ).75 Cinnamon_Toast_Crunch Clusters 140 13 105 0.5 Cocoa Puffs .80 12 Count_Chocula 180 12 0.75 Crispy_Wheat_& Raisins 140 11 120 15 Golden_Graham 280 0.75 11.5 0.75 Honey Nut_Cheerios 260 1.5 Kix 21 Lucky_Charms 12 - - Multi-Grain_Cheerios 0.5 Oatmeal Raisin_Crisp 13.5 1.25 0.5 Raisin_Nut_Bran 10.5 Total_Corn_Flakes 21 15 1.5 Total_Raisin_Bran Total_Whole_Grain 16 Triples 21 0.75 13 Trix 17 Wheaties Wheaties_Honey_Gold 16 0.3 All-Bran 8 0.5 All-Bran_with_Extra_Fiber Apple Jacks 11 Corn Flakes 21 Corn_Pops - W W N W W N W A G N N N W W W W N W W N W W - N N W - N N A AN W - N W W N W W N NNW - N - - W - OWN 10 0.5 Cracklin'_Oat Bran Crispix Froot Loops 0.75 Frosted Flakes 0.8 Frosted_Mini-Wheats 1.33 0.67 Fruitful_Bran Just Right_Crunchy Nuggets 0.75 Just_Right_Fruit_&_Nut 0.67 Mueslix_Crispy_Blend 0.67 Nut&Honey_Crunch 0.67 Nutri-Grain_Almond-Raisin Nutri-grain_Wheat 1 Product_19 1.33 0.75 Raisin_Bran 0.5 Raisin_Squares 1 Rice Krispies Smacks - NO O O O O O - O H OO- OON- N- - OOO- OWOOOO- - - - - - - - NN- N W W N - - - N W I N - W N W W W N W W W W N - N W W N - N W W - - N W W W W W W - N N - N W N N W N - W -N - - 0.75 1 Special K 0.33 100%_Bran Cream_of_Wheat_(Quick) 0.83 Shredded_Wheat 0.67 Shredded_Wheat_'n'Bran 0.67 Shredded_Wheat_spoon_size Strawberry_Fruit_Wheats 0.67 Bran Flakes 1.25 0.67 Fruit_&_Fibre_Dates,_Walnuts, and_Oats 135 1 0.75 Fruity_PebblesGolden_Crisp 100 0.88 Grape_Nuts_Flakes ).88 Grape-Nuts .25 Great_Grains_Pecan 0.33 Honey-comb 1.33 Post_Nat. Raisin_Bran 1.33 0.67 100%_Natural_Bran Cap'n Crunch ).75 Honey_Graham_Ohs 12 Life W H A A N N N N U A N H A H H W W - W WW N HOWWOO-NNHOONNNUHOWOHO IN - ON- ON a O WWWO 12 0.67 Puffed_Rice 13 0.5 Puffed_Wheat 10 0.5 Quaker_Oat_Squares 14 0.5 Quaker_Oatmeal 2.7 OWWHOARE -1 0.67 Almond_Delight 14 Bran_Chex Corn_Chex Double_Chex 18 W N = = u w a a L a o o a = JO S = A WUT 0.75 15 22 - - W W W - - W - W W W N N N W W - W W W - 0.67 ).75 Muesli_Raisins, Dates,_&_Almonds 16 Muesli_Raisins, Peaches, &_Pecans 16 Rice_Chex 240 23 1.13 Wheat_Chex R 230 17 0.67 Statistical concepts used in this lab: Using the Introductory to Statistics Excel Lab Manual Creating Frequency Distributions Graphing Frequency Histograms Graphing Box-n-whisker Plots Identifying the shape of distributions LAB INSTRUCTIONS Use the Introductory to Statistics Excel Lab Manual to help you understand how to create and interpret the graphs in this lab assignment. The data set for this course has already been formatted, entered into an Excel worksheet and posted in Blackboard. The names of each variable are in the first row of the Worksheet. This row has a background color of gray to identify it as the variable names. All other rows of the Worksheet represent a brand of cereal. Therefore, the rows are called observations and the columns are called variables Follow the directions below and then paste the graphs from Excel in the gray areas for question 1 through 5. Type your answers to questions 6 through 10 where noted in the gray areas. When asked for explanations, please give thorough, multi-sentence or paragraph length explanations. This completed Lab Word Document with your responses to the 10 questions will be the ONLY document you will upload in Blackboard.Creating Graphs Create a frequency distribution to indicate Average Sodium content for each manufacturer. (10 points) Manufacturer Number of Brands Average Sodium Content Use the Introductory to Statistics Excel Lab Manual (pages 5-8) to create a Grouped Histogram with 6 classes for the variable Sodium from the Cereal Data. Copy and paste the graph below. (15 points) Use the Introductory to Statistics Excel Lab Manual (pages 5-8) to create a Grouped Histogram with 6 classes for the variable Sodium using only manufacturers K and G. Copy and paste the graph below. (15 points) (15 points) Use the Introductory to Statistics Excel Lab Manual (pages 17-19) to create a Box-and-Whisker plot (Box Plot) for the Sodium content of the population.Create a box-and-whisker plot of the Sodium content for a sample. Use either the Cluster or Stratified technique. (15 points) 13 TA 75 T6 10 17 Short Answer Writing Assignment 12 13 14 15 17 All answers should be complete sentences. What is your interpretation of the histogram created for the Sodium content (include the shape)? What does this tell you about the data? (6 points) (6 points) How do the histograms in #2 and #3 compare? Is this what you expected? Explain. (6 points) Are there any outliers present in the Sodium content population data? Can you tell from the Histogram? Is it more/less obvious from the Box-and Whiskers Plot? Are there any outliers present in the Sodium content sample data used to create the Box-and Whiskers plot? (6 points)Use the Introductory to Statistics Excel Lab Manual (pages 14-16) to calculate the Descriptive Statistics for the Sodium content of the population. What is the Mean, Median and Skewness? How does this information relate to the shape of the distribution? (6 points) Mean: Median: Skewness
Step by Step Solution
There are 3 Steps involved in it

Get step-by-step solutions from verified subject matter experts