

Question: can you please plot the plot the graph in MS project with the start and end dates, plus the added resources? The question was answered
can you please plot the plot the graph in MS project with the start and end dates, plus the added resources? The question was answered few hours ago but it was missing the graph part.
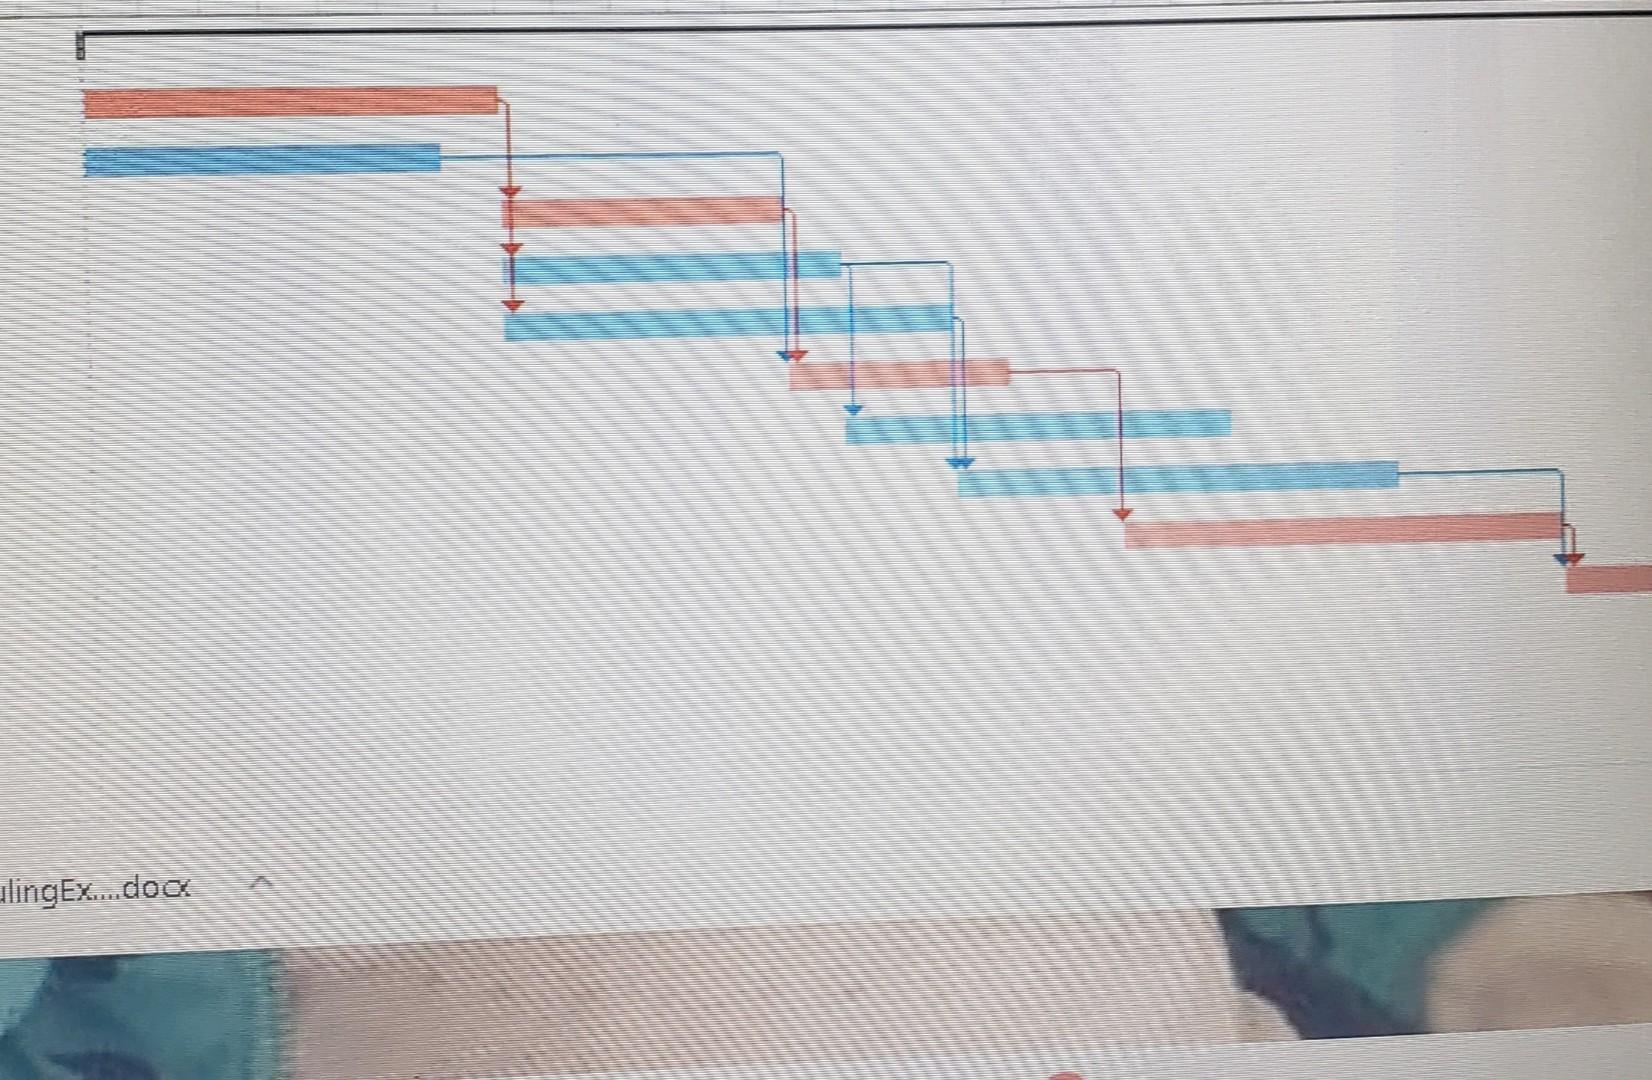
I was referring to a graph like this in ms project
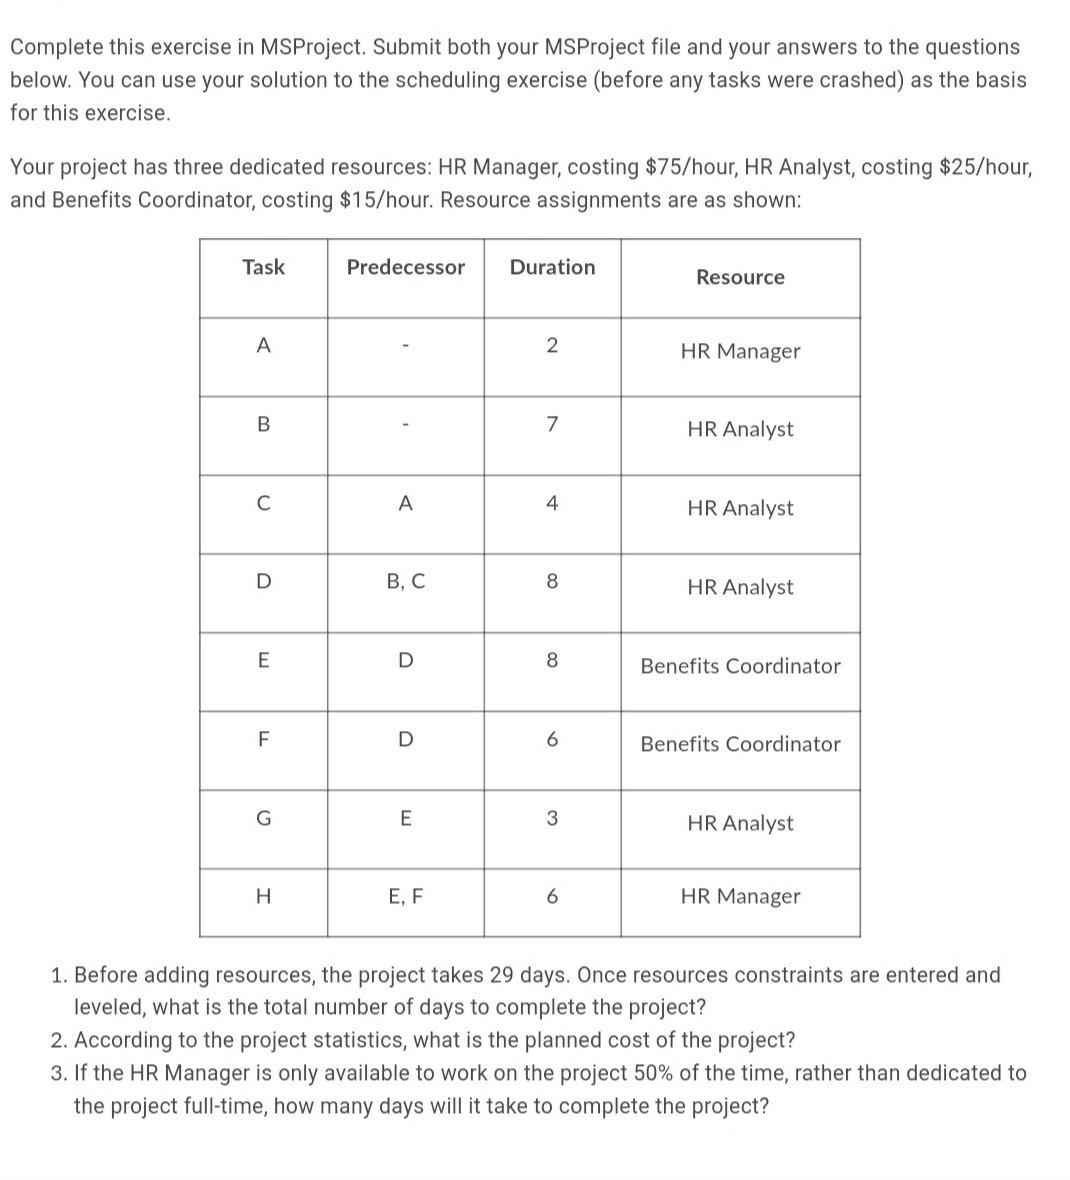
Complete this exercise in MS Project. Submit both your MS Project file and your answers to the questions below. You can use your solution to the scheduling exercise (before any tasks were crashed) as the basis for this exercise. Your project has three dedicated resources: HR Manager, costing $75/hour, HR Analyst, costing $25/hour, and Benefits Coordinator, costing $15/hour. Resource assignments are as shown: Task Predecessor Duration Resource A 2 HR Manager B 7 HR Analyst A 4 HR Analyst D B, C 8 HR Analyst E D 8 Benefits Coordinator F D 6 Benefits Coordinator G E 3 HR Analyst H E, F 6 HR Manager 1. Before adding resources, the project takes 29 days. Once resources constraints are entered and leveled, what is the total number of days to complete the project? 2. According to the project statistics, what is the planned cost of the project? 3. If the HR Manager is only available to work on the project 50% of the time, rather than dedicated to the project full-time, how many days will it take to complete the project? alingEx....docStep by Step Solution
There are 3 Steps involved in it
1 Expert Approved Answer
Step: 1 Unlock

Question Has Been Solved by an Expert!
Get step-by-step solutions from verified subject matter experts
Step: 2 Unlock
Step: 3 Unlock