

Question: Can you please provide the excel formulas to answer the questions below? Here is the information from a previous question asked in Chegg, but I
Can you please provide the excel formulas to answer the questions below? Here is the information from a previous question asked in Chegg, but I am having trouble understanding how this information was found. Can you use the data to show excel equations to provide how the explanation to build come size income statements for 2016,2017 and 2018 was found?
Explanation: ==> 1. Build common size income statements for year 2016, 2017 and 2018: - Income Statement : Estimate the free cash flow of 2019 under the following assumptions. Assumptions: 1. Year 2019 sales projection: $31,556,000,000 2. All the other income statement accounts are assumed to hold a constant percentage as sales. The percentage is the average percentage of fiscal years 2016, 2017 and 2018. 3. Investment in net operating working capital and capital expenditure are assumed to stay perpetually as the average of year 2017 and 2018. Requirements: 1. Build common size income statements for year 2016, 2017 and 2018. 2. Prepare a pro forma income statement for year 2019.
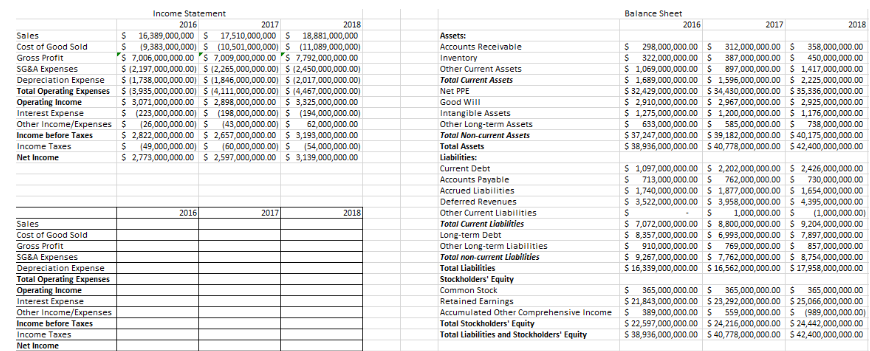
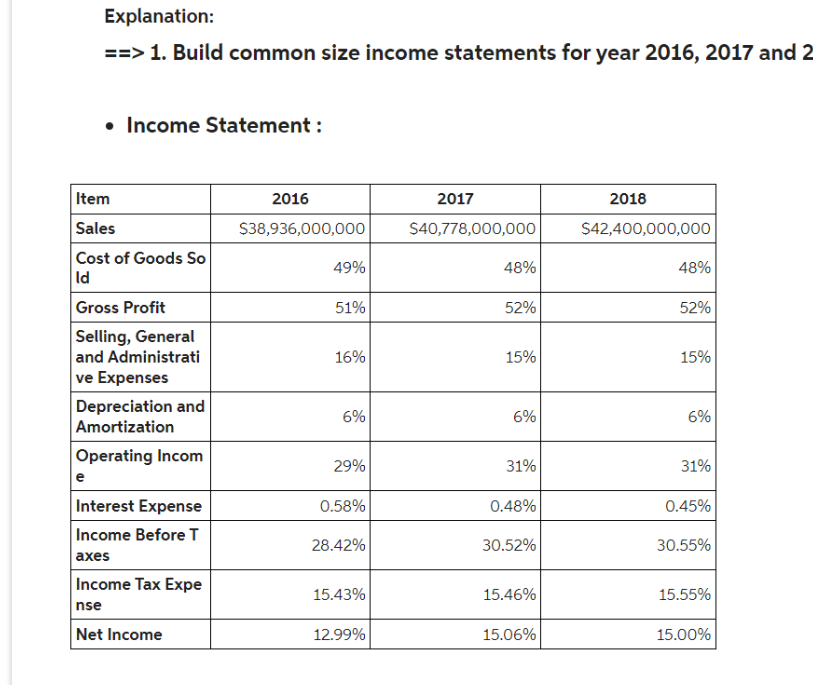
\begin{tabular}{|c|c|c|c|c|c|c|c|} \hline \multicolumn{4}{|c|}{ Income Statement } & \multicolumn{4}{|c|}{ Balance Sheet } \\ \hline & 2016 & 2017 & 2018 & & 2016 & 2017 & 2018 \\ \hline Soles & 16,389,000,000 & 17,510,000,000 & S 18,881,000,000 & Assets: & & & \\ \hline Cost of Good Sold & {[9,383,000,000]} & S (10,501,000,000) & S (11,089,000,000) & Accounts Receivable & S 298,000,000.00 & 312,000,000.00 & 358,000,000.00 \\ \hline Gross Protit & '\$ 7,006,000,000.00 & 's 7,009,000,000.00 & is 7,792,000,000.00 & Inventory & \$ 322,000,000.00 & 387,000,000.00 & 450,000,000.00 \\ \hline SGBA Expenses & $(2,197,000,000.00) & $(2,265,000,000.00) & $(2,450,000,000.00) & Other Current Assets & $1,069,000,000.00 & $897,000,000.00 & \$ 1,417,000,000.00 \\ \hline Depreciation Expense & $(1,738,000,000.00) & $(1,846,000,000.00) & $(2,017,000,000.00) & Totol Current Assets & $1,689,000,000.00 & $1,596,000,000.00 & $2,225,000,000.00 \\ \hline Total Operating Expenses & $(3,935,000,000.00) & $(4,111,000,000.00) & $(4,457,000,000.00) & Net PPE & $32,429,000,000.00 & $34,430,000,000.00 & $35,336,000,000.00 \\ \hline Operating Income & $3,071,000,000.00 & $2,898,000,000.00 & $3,325,000,000.00 & Good Will & $2,910,000,000.00 & S 2,967,000,000.00 & $2,925,000,000.00 \\ \hline Interest Expense & $(223,000,000.00) & $(198,000,000.00) & $(194,000,000.00) & Intangible Assets & $1,275,000,000.00 & \$ 1,200,000,000.00 & $1,176,000,000.00 \\ \hline Other Income/Expenses & $[26,000,000.00] & $(43,000,000.00] & 62,000,000.00 & Other Long-term Assets & $633,000,000.00 & \$ 585,000,000.00 & $738,000,000.00 \\ \hline Income before Taxes & $2,822,000,000.00 & $2,657,000,000.00 & $3,193,000,000.00 & Total Non-current Assets & $37,247,000,000.00 & $39,182,000,000.00 & $40,175,000,000.00 \\ \hline Income Taxes & $(49,000,000.00) & $(60,000,000.00) & $(54,000,000.00) & Total Assets & $38,936,000,000.00 & $40,778,000,000,00 & $42,400,000,000.00 \\ \hline Net Income & $2,773,000,000.00 & $2,597,000,000.00 & $3,139,000,000,00 & Liabilities: & & & \\ \hline & & & & Current Debt & \$ 1,097,000,000.00 & S 2,202,000,000,00 & S 2,426,000,000.00 \\ \hline & & & & Accounts Poyoble & S 713,000,000.00 & S 762,000,000,00 & S 730,000,000.00 \\ \hline & & & & Accrued Liabilities & S 1,740,000,000.00 & S 1,877,000,000.00 & S 1,654,000,000.00 \\ \hline & & & & Deterred Revenues & S 3,522,000,000.00 & S 3,958,000,000.00 & S 4,395,000,000.00 \\ \hline & 2016 & 2017 & 2018 & Other Current Liabilities & s & 1,000,000.00 & (1,000,000.00) \\ \hline Sales & & & & Totol Current Liabifities & $7,072,000,000.00 & S 8,800,000,000.00 & \$ 9,204,000,000.00 \\ \hline Cost of Good Sold & & & & Long-term Debt & $8,357,000,000.00 & $6,993,000,000.00 & $7,897,000,000.00 \\ \hline Gross Profit & & & & Other Long-term Liabilities & $910,000,000.00 & $769,000,000.00 & $857,000,000.00 \\ \hline SGBA Expenses & & & & Totol non-current Liobilities & $9,267,000,000.00 & \$ 7,762,000,000.00 & $8,754,000,000.00 \\ \hline Depreciation Expense & & & & Total Liabilities & $16,339,000,000.00 & $16,562,000,000.00 & $17,958,000,000.00 \\ \hline Total Operating Expenses & & & & Stockholders' Equity & & & \\ \hline Operating Income & & & & Common Stock & $365,000,000.00 & \$ 365,000,000.00 & $365,000,000.00 \\ \hline Interest Expense & & & & Retained Earnings & $21,843,000,000.00 & $23,292,000,000.00 & $25,066,000,000.00 \\ \hline Other Income/Expenses & & & & Accumulated Other Comprehensive Income & $389,000,000.00 & \$ 559,000,000,00 & $(989,000,000.00) \\ \hline Income before Taxes & & & & Total Stockholders' Equity & $22,597,000,000,00 & $24,216,000,000,00 & $24,442,000,000.00 \\ \hline Income Taxes & & & & Total Liabilities and Stockholders' Equity & $38,936,000,000.00 & $40,778,000,000,00 & $42,400,000,000,00 \\ \hline \end{tabular} Explanation: ==> 1. Build common size income statements for year 2016, 2017 and 2 - Income Statement
Step by Step Solution
There are 3 Steps involved in it

Get step-by-step solutions from verified subject matter experts