

Question: can you please put in decimal form c. Create a spreadsheet similar to Table 3.8 to perform the following analysis: (1) Create a table that

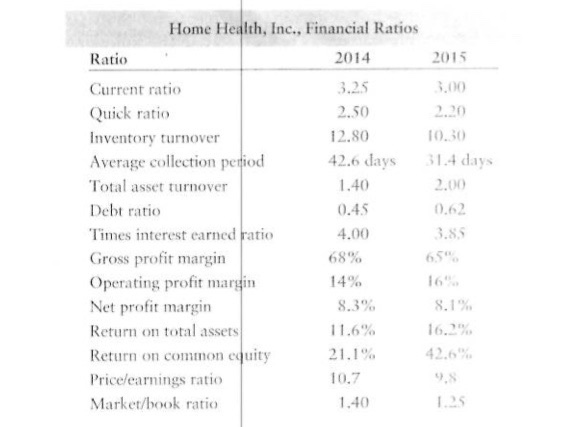
c. Create a spreadsheet similar to Table 3.8 to perform the following analysis: (1) Create a table that reflects both 2015 and 2014 operating ratios for Dayton, Inc., segmented into (a) liquidity, (b) activity, (c) debt, (d) profitability, and (e) market. Assume that the current market price for the stock is $90. (2) Compare the 2015 ratios to the 2014 ratios. Indicate whether the results "outperformed the prior year" or "underperformed relative to the prior year," 1.40 Home Health, Inc., Financial Ratios Ratio 2014 2015 Current ratio 3.25 Quick ratio 2.50 Inventory turnover 12.80 10.30 Average collection period 42.6 days 31.4 days Total asset turnover 2.00 Debt ratio 0.45 Times interest earned ratio 4.00 Gross profit margin 68% Operating profit margin Net profit margin 8.3% 8.1% Return on total assets 11.6% Return on common equity 21.1% Price/earnings ratio 10.7 9. Market/book ratio 1.40
Step by Step Solution
There are 3 Steps involved in it

Get step-by-step solutions from verified subject matter experts