

Question: only c 1 and 2 c. Create a spreadsheet similar to Table 3.10 to perform the following analysis: (1) Create a table that reflects both
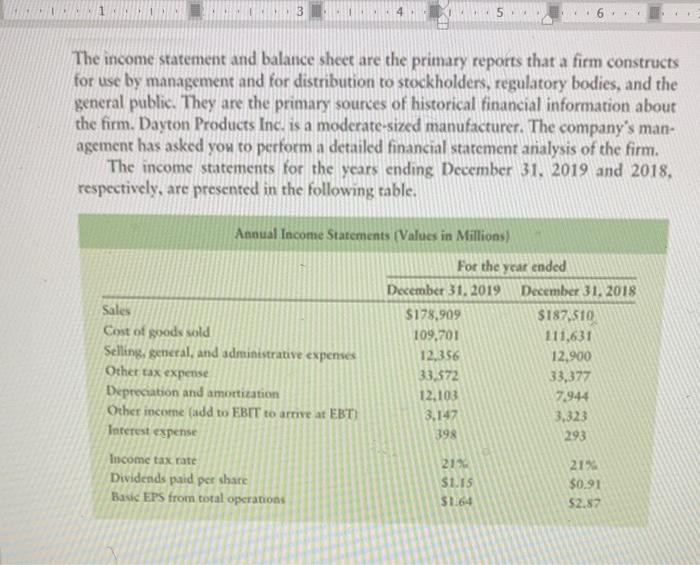
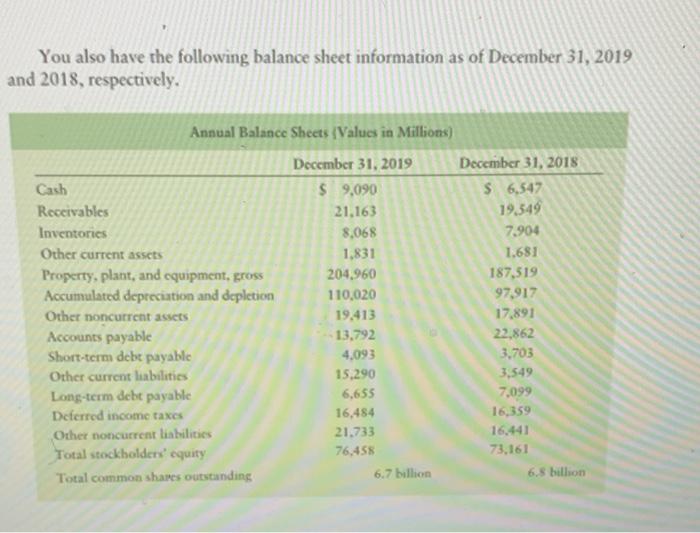
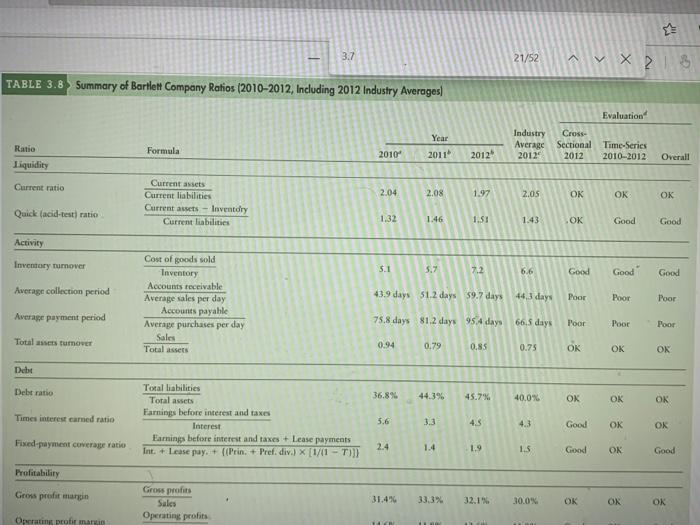
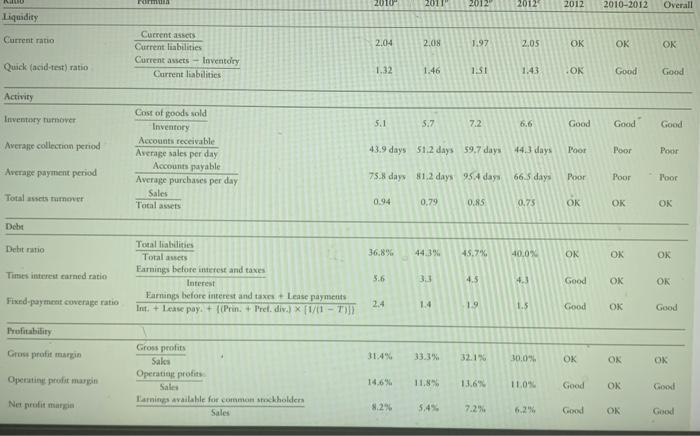
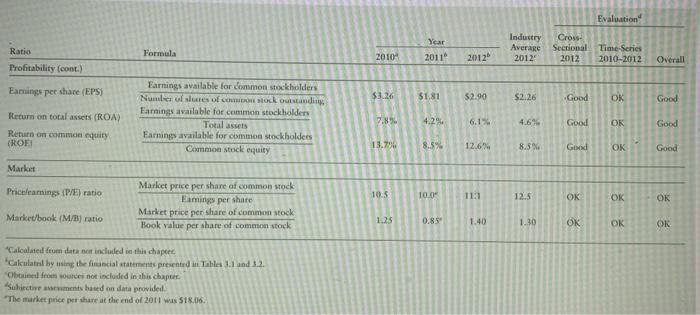
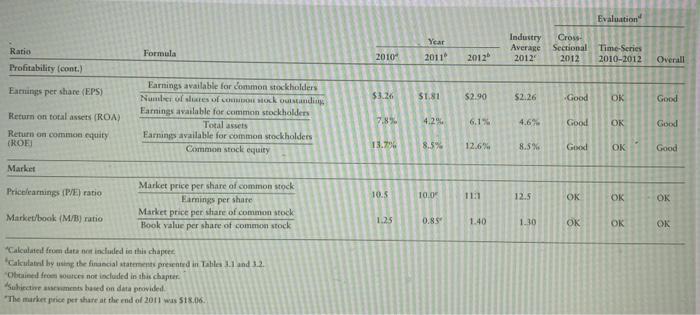
c. Create a spreadsheet similar to Table 3.10 to perform the following analysis: (1) Create a table that reflects both 2019 and 2018 operating ratios for Dayton Inc., segmented into (a) liquidity, (b) activity. (c) debt, (d) profitability, and (e) market. Assume that the current market price for the stock is $90. (2) Compare the 2019 ratios to the 2018 ratios. Indicate whether the results Moutperformed the prior year" or underperformed relative to the prior year." 11 3 4 5 The income statement and balance sheet are the primary reports that a firm constructs for use by management and for distribution to stockholders, regulatory bodies, and the general public. They are the primary sources of historical financial information about the firm. Dayton Products Inc. is a moderate-sized manufacturer. The company's man- agement has asked you to perform a detailed financial statement analysis of the firm. The income statements for the years ending December 31, 2019 and 2018, respectively, are presented in the following table. Annual Income Statements (Values in Millions) Sales Cost of goods sold Selling, general, and administrative expenses Other tax expense Depreciation and amortization Other income (add to EBIT to arrive at EBT) Interest expense Income tax rate Dividends paid per share Basic EPS from total operations For the year ended December 31, 2019 December 31, 2018 $178,909 $187.510 109,701 111.631 12,356 12,900 33,372 33,377 12.103 7.944 3,147 3,323 293 398 21% $1.15 $1.64 21% $0.91 52.87 You also have the following balance sheet information as of December 31, 2019 and 2018, respectively. 19,349 Annual Balance Sheets Values in Millions) December 31, 2019 December 31, 2018 Cash $ 9,090 $ 6,547 Receivables 21.163 Inventories 8,068 7.904 Other current assets 1,831 1.681 Property, plant, and equipment, gross 204.960 187,519 Accumulated depreciation and depletion 110,020 97,917 Other noncurrent assets 19,413 17.891 Accounts payable 13,792 22,862 Short-term debt payable 4,093 3,703 Other current liabilities 15,290 3.549 Long-term debt payable 6,655 7.099 Deferred income taxes 16,484 16,359 Other noncurrent liabilities 21.733 16,441 Total stockholders' equity 76.458 73.161 Total common shares outstanding 6.7 billion 6.5 billion HIP 3.7 21/52 X ? TABLE 3.8 Summary of Bartlett Company Ratios (2010-2012, Including 2012 Industry Averages) Evaluation Ratio Liquidity Formula Year 2011 Industry Cross- Average Sectional 2012 2012 2010 2012 Time-Series 2010-2012 Overall Current ratio 2.04 2.08 1.97 2.05 OK OK OK Current assets Current liabilities Current assets - Inventdry Current liabilities Quick (acid-test) ratio 1.32 1.46 1.51 1.43 OK Good Good Activity Inventory turnover 5.1 5.7 7.2 6.6 Good Good" Good Average collection period 43.9 days 51.2 days $9.7 days 443 days Poor Poor Cost of goods sold Inventory Accounts receivable Average sales per day Accounts payable Average purchases per day Sales Total assets Poor Average payment period 75.8 days 81.2 days 954 days 66. 5 days Poor Poor Poor Total assets turnover 0.94 0.79 0.85 0.75 OK OK OK Debt Debt ratio 36.896 44.3% 45.7% 40.0% OK OK OK Times interest earned ratio Total liabilities Total assets Farnings before interest and taxes Interest Earnings before interest and taxes + Lease payments Int. + Lease pay, + (Prin + Pref. div.) [1/(1-7) 5.6 3.3 43 4.3 Good OK OK Fixed-payment coverage ratio 2.4 1.4 1.9 1.5 Good OK Good Profitability Gross profit margin Gross profits Sales Operating profits 31.4% 33.3% 32.1%. 30.0% OK OK OK Operating profit margin NO Edit 2010 2011 2012 2012 2012 2010-2012 Overall Liquidity Current ratio 2.04 2.08 1.92 2.05 OK OK Current assets Current liabilities Current assets - loventory Current liabilities Quick (acid-test) ratio 1.32 1.46 1.51 1.43 .OK Good Goud Activity Inventory rumover 5.1 5.7 7.2 6.6 Good Good Good Average collection period 43.9 days 51.2 days 59.7 days 44.3 days Poor Poor Pour Cost of goods sold Inventory Accounts receivable Average sales per day Accounts payable Average purchases per day Sales Total assets Average payment period 75.8 days 81.2 days 95.4 days 66 3 days Poor Poor Poor Total assets turnover 0.94 0.79 0.85 0.75 OK OK Debt Debt ratio 36,8% 44.390 45.7% 40,0% OK OK Times interest earned ratio Total liabilities Total assets Earnings before interest and taxes Interest Kaming before interest and taxes + Lease payments Int + Lease payPrin + Pref. div.) [10 - 5.6 3 4.5 4. Good OK Fixed payment coverage ratio 2.4 1.4 19 1.3 Good OK Good Profitability Gross profit margin 31.4% 33.3% 32.1% 30.0% OK ON OK Operating profit margin Gross profits Sales Operating profits Sales Earnings available for common stockholden Sales 14.6% 11.8% 13.6% 11.04 Good OK Good Net profit margi 8.2% 5,4% 7.2% Good OK Good Evaluation" Year Industry Average 2012 Ratio Profitability cont.) Cross- Sectional 2012 Formula 2010- 2011 2012 Time-Series 2010-2012 Overall Earnings per share (EPS) $3.24 $1.81 52.90 $2.26 Good OK Good Earnings available for common stockholders Number of succes of stock outstanding Earnings available for common stockholders Total assets Earnings available for common stockholders Common stock equity 7.8% 4.2% 6.1% 4.676 Good Return on total assets (ROA) Return on common equity (ROEI Good 13.79 8.5% 12.6% 8.5% Good OK Good Market Pricelearnings (P/E) ratio 10.5 10.04 113 12.5 OK OK OK Market price per share of common sock Eimings per share Market price per share of common stock Book value per share of common stock Market/book (M/B) ratio 1.25 0.85 1.40 1.30 OK OK OK Calculated from data not included in this chapeet "Calculated by using the financial statements presented in Table 1.1 and 3.2. Obtained from sources not included in this chapter Subiectivements based on data provided "The market price per share at the end of 2011 was $18.06. Evaluation Year Industry Average 2012 Ratio Profitability (cont.) Cross- Sectional 2012 Formula 2010- 2011 2012 Time-Series 2010-2012 Overall Earnings per share (EPS) 53.26 $1.81 $2.90 52.26 Good OK Good Earnings available for common stockholders Nume of succes of Rock outstanding Earnings available for common stockholders Total assets Earnings available for common stockholders Common stock equity 7.8% 4.2% 6.1% 4.6% Good OK Return on total assets (ROA) Return on common equity (ROE) Good 13.79 8.5% 12.64 8.5% Good OK Good Market Pricelearnings (P/E) ratio 10.5 10.0" 1121 12.5 OK OK OK Market price per share of common stock Earnings per share Market price per share of common stock Book value per share of common stock Market/book (M/B) ratio 1.25 0.85 1.40 1.30 OK OK Calcolated from data not included in this chapter "Calculated by using the financial statements presented in Table 11 and 3.2. Obtained from sources not included in this chapter Subiective assements based on data provided "The market price share at the end of 2011 was $18.06
Step by Step Solution
There are 3 Steps involved in it

Get step-by-step solutions from verified subject matter experts