

Question: Can you please solve this question on excel? The exercise, although simple, has enough features to capture all the aspects that would be relevant even
Can you please solve this question on excel?
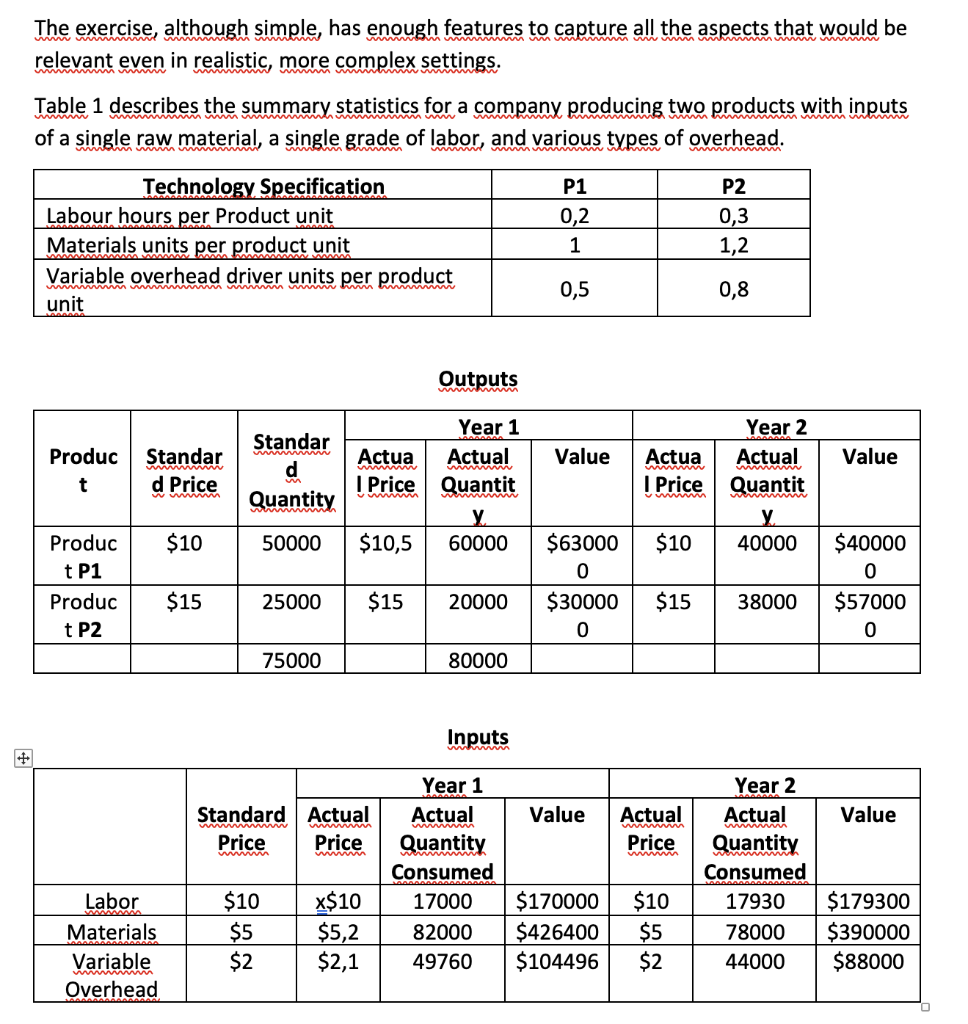
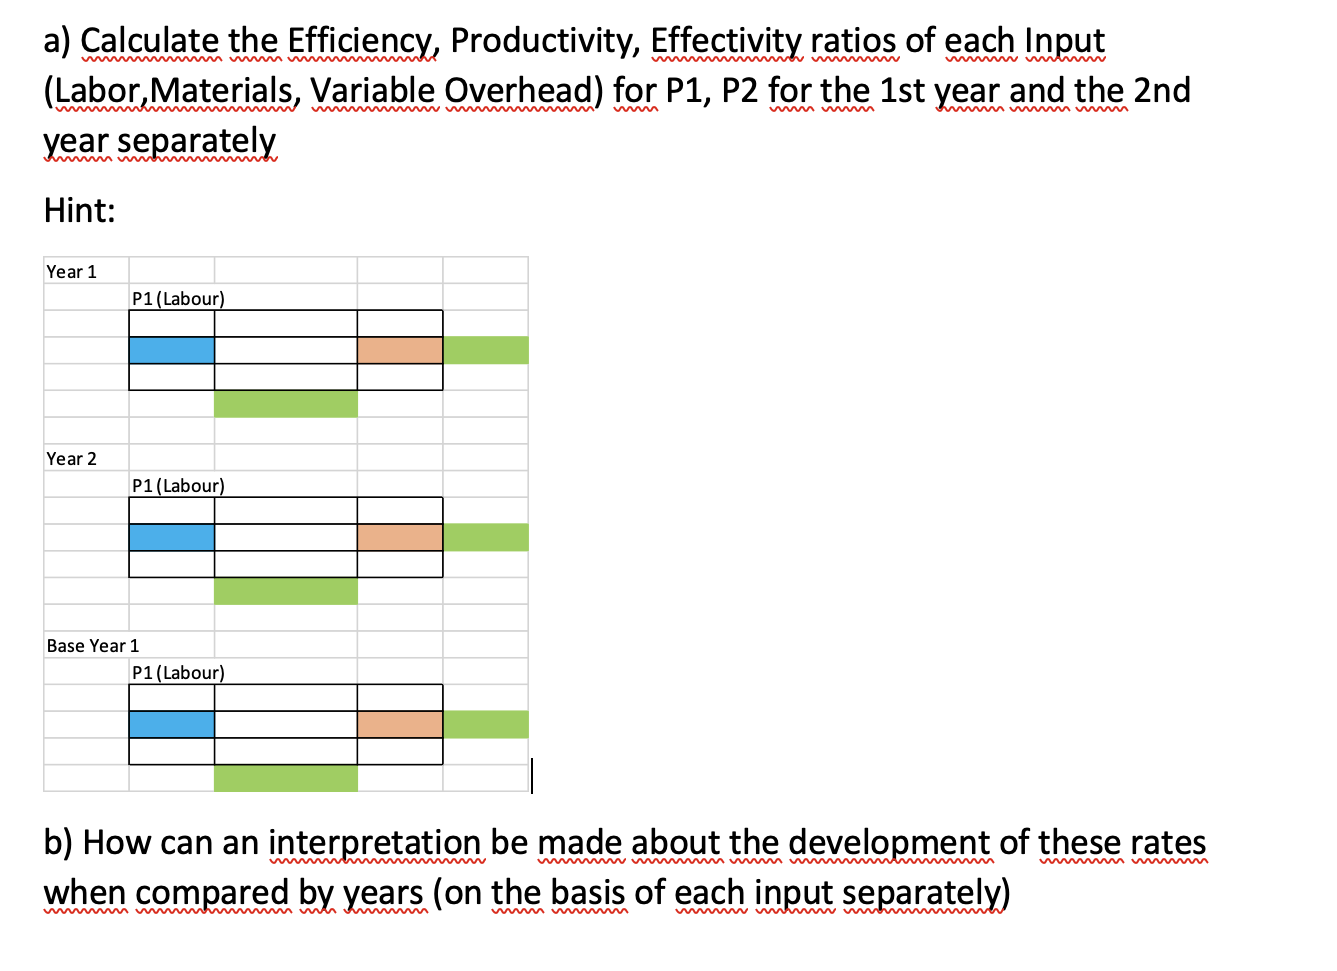
The exercise, although simple, has enough features to capture all the aspects that would be relevant even in realistic, more complex settings. wwwwwwwwww Www www Table 1 describes the summary statistics for a company producing two products with inputs of a single raw material, a single grade of labor, and various types of overhead. P1 0,2 Technology Specification Labour hours per Product unit Materials units per product unit Variable overhead driver units per product unit P2 0,3 1,2 1 0,5 0,8 Outputs w Value Value www WANAW Produc t Standar d Price Standar d Quantity Year 1 Actua Actual | Price Quantit y $10,5 60000 Year 2 Actua Actual Price Quantit y $10 40000 WWW $10 50000 Produc t P1 Produc t P2 $63000 0 $30000 0 $40000 0 $57000 0 $15 25000 $15 20000 $15 38000 75000 80000 Inputs Value Value Standard Actual Price Price Actual Price w Year 1 Actual Quantity Consumed 17000 82000 49760 Year 2 Actual Quantity Consumed 17930 78000 44000 Labor Materials Variable Overhead $10 $5 $2 X$10 $5,2 $2,1 $170000 $426400 $104496 $10 $5 $2 $179300 $390000 $88000 a) Calculate the Efficiency, Productivity, Effectivity ratios of each Input (Labor, Materials, Variable Overhead) for P1, P2 for the 1st year and the 2nd year separately Hint: Year 1 P1 (Labour) Year 2 P1 (Labour) Base Year 1 P1 (Labour) b) How can an interpretation be made about the development of these rates when compared by years (on the basis of each input separately) The exercise, although simple, has enough features to capture all the aspects that would be relevant even in realistic, more complex settings. wwwwwwwwww Www www Table 1 describes the summary statistics for a company producing two products with inputs of a single raw material, a single grade of labor, and various types of overhead. P1 0,2 Technology Specification Labour hours per Product unit Materials units per product unit Variable overhead driver units per product unit P2 0,3 1,2 1 0,5 0,8 Outputs w Value Value www WANAW Produc t Standar d Price Standar d Quantity Year 1 Actua Actual | Price Quantit y $10,5 60000 Year 2 Actua Actual Price Quantit y $10 40000 WWW $10 50000 Produc t P1 Produc t P2 $63000 0 $30000 0 $40000 0 $57000 0 $15 25000 $15 20000 $15 38000 75000 80000 Inputs Value Value Standard Actual Price Price Actual Price w Year 1 Actual Quantity Consumed 17000 82000 49760 Year 2 Actual Quantity Consumed 17930 78000 44000 Labor Materials Variable Overhead $10 $5 $2 X$10 $5,2 $2,1 $170000 $426400 $104496 $10 $5 $2 $179300 $390000 $88000 a) Calculate the Efficiency, Productivity, Effectivity ratios of each Input (Labor, Materials, Variable Overhead) for P1, P2 for the 1st year and the 2nd year separately Hint: Year 1 P1 (Labour) Year 2 P1 (Labour) Base Year 1 P1 (Labour) b) How can an interpretation be made about the development of these rates when compared by years (on the basis of each input separately)
Step by Step Solution
There are 3 Steps involved in it

Get step-by-step solutions from verified subject matter experts