

Question: can you please specify and describe what each comand does. matlab %part A subplot(2,1,1) fplot(@(ti) sin(2*pi*(ti.^2/4)), [8]) xlabel('time) ylabel('Phase') title('Sine wave') subplot(2,1,2) t = 0:1/8:8;
can you please specify and describe what each comand does. matlab 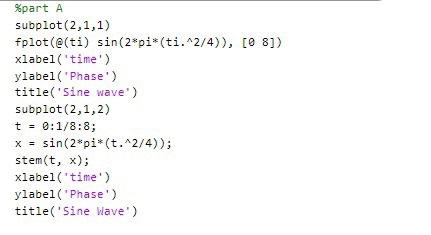
%part A subplot(2,1,1) fplot(@(ti) sin(2*pi*(ti.^2/4)), [8]) xlabel('time) ylabel('Phase') title('Sine wave') subplot(2,1,2) t = 0:1/8:8; x = sin(2*pi* (t^2/4)); stem(t, x); xlabel('time) ylabel('Phase') title('Sine Wave') =
Step by Step Solution
There are 3 Steps involved in it
1 Expert Approved Answer
Step: 1 Unlock

Question Has Been Solved by an Expert!
Get step-by-step solutions from verified subject matter experts
Step: 2 Unlock
Step: 3 Unlock