

Question: Can you please verify the attached graph is correct for the following questions? Demand for parking in the City of Chambana is given by Q
Can you please verify the attached graph is correct for the following questions?
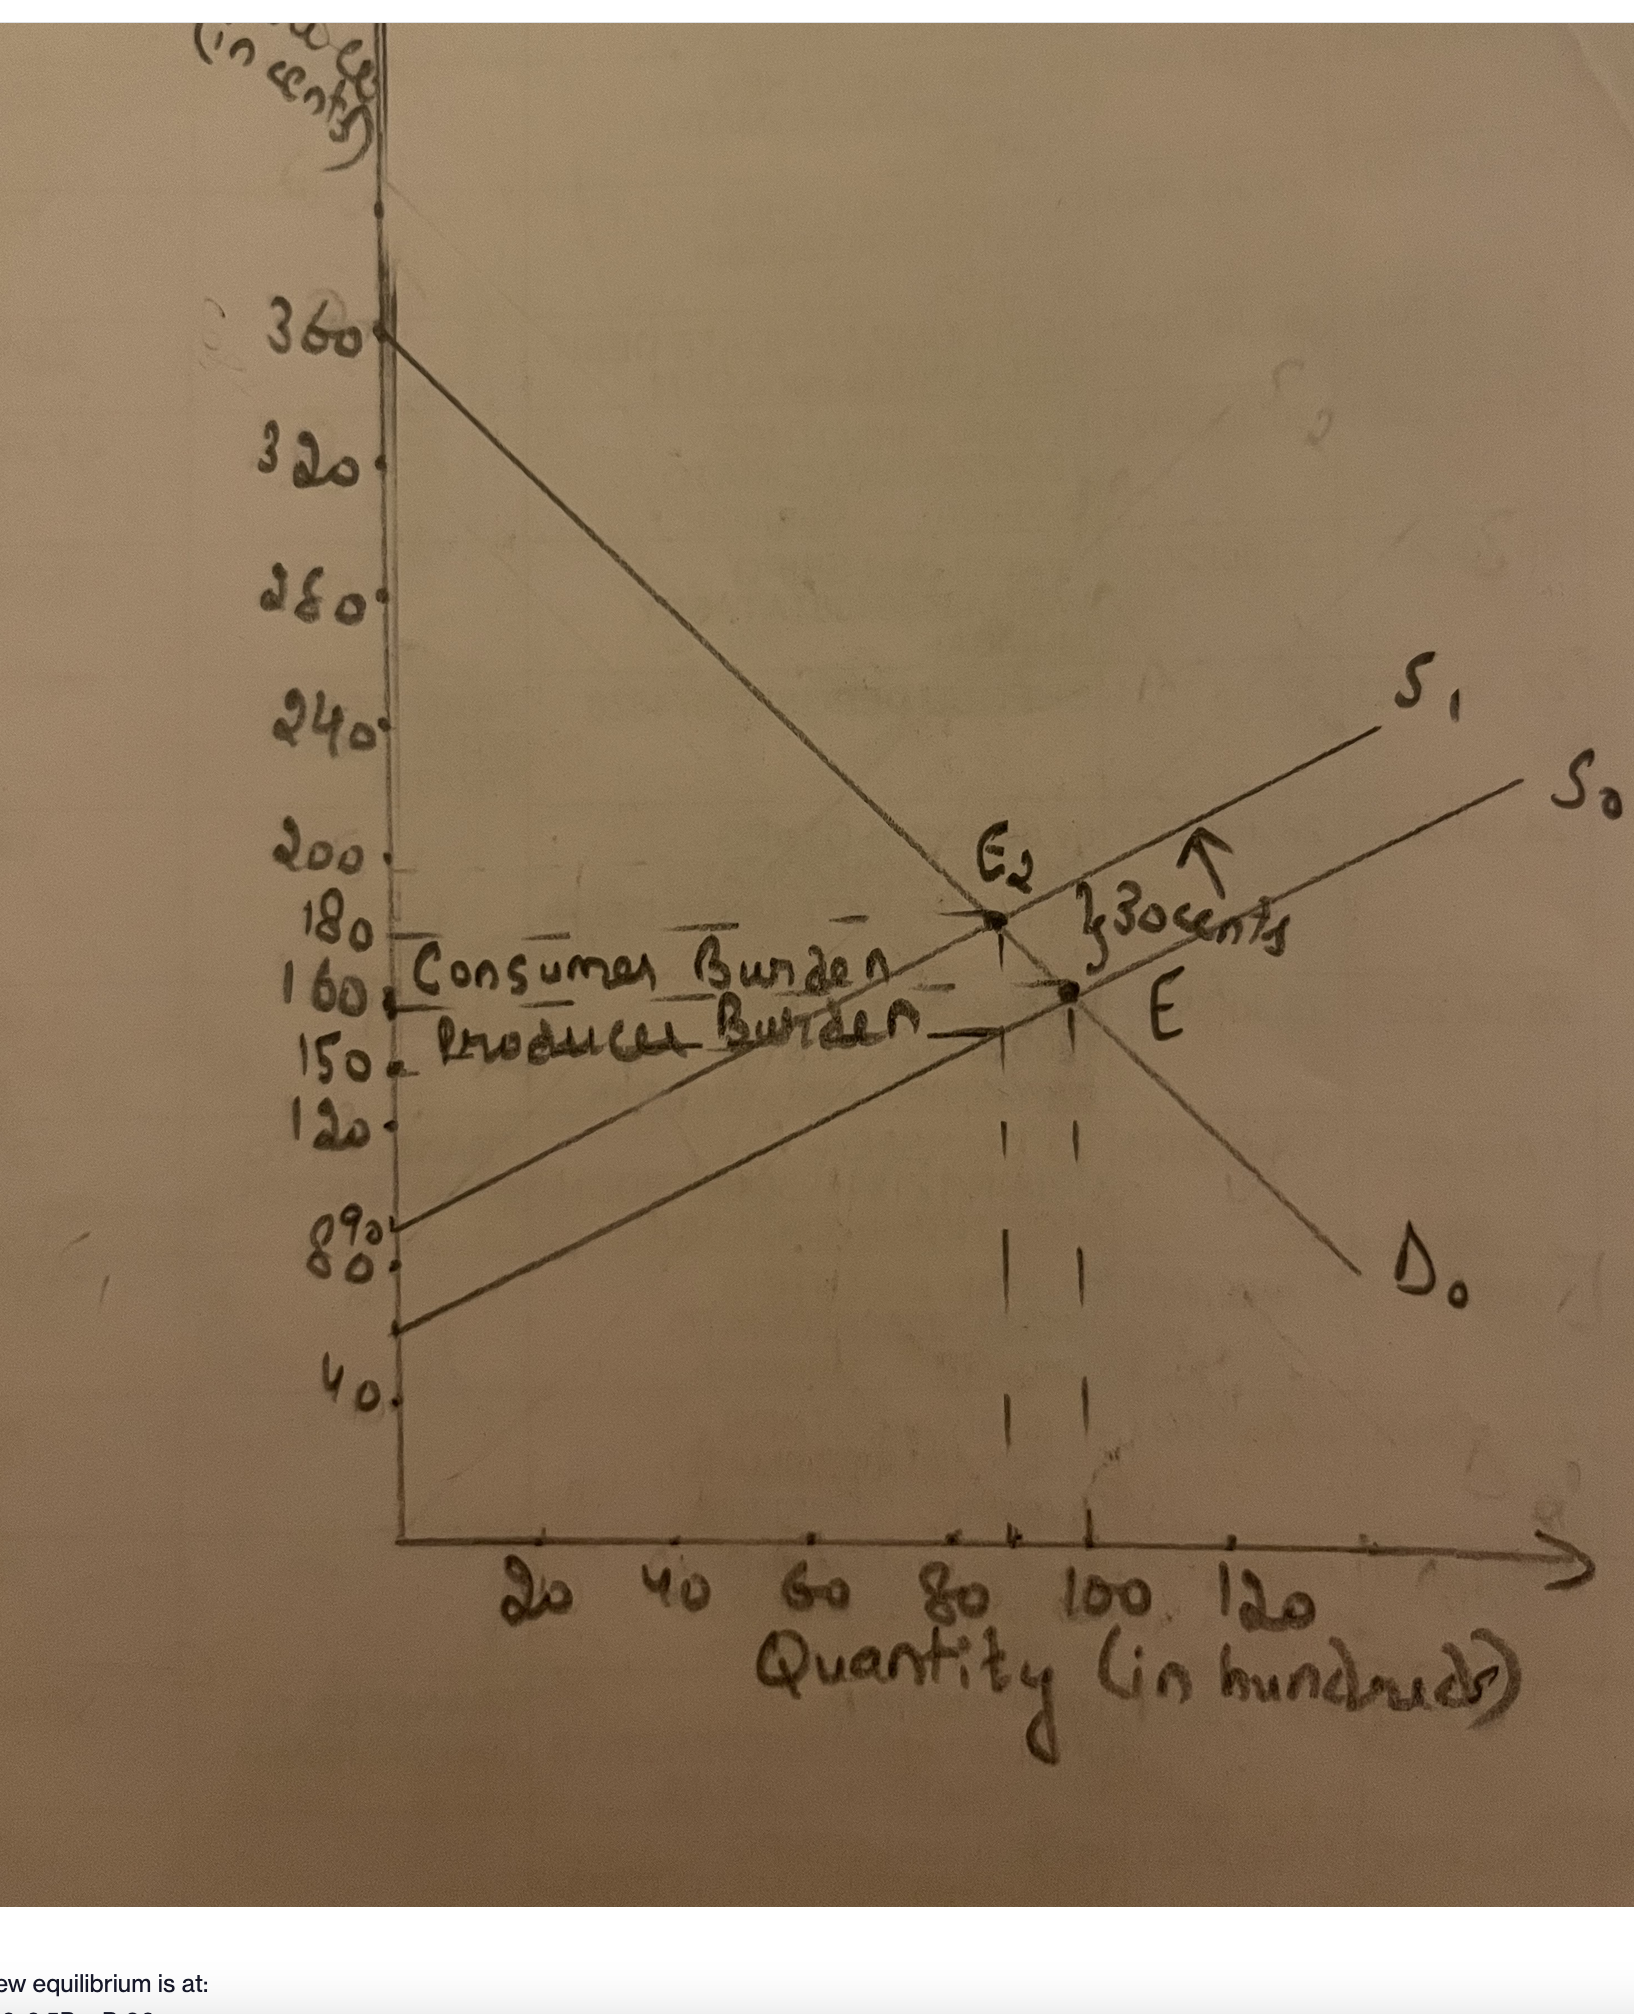
Demand for parking in the City of Chambana is given by Qd= 180 - 0.5P, and the supply is Qs= P - 60, where price is in cents per car per day and quantity is in hundreds of cars parked per day.
- Draw a graph of the given demand and supply curve and label it as D0 and S0.
- Indicate numerically all relevant intercepts for your demand and supply curves on your graph.
- Find the short run equilibrium price and quantity in this market and label the numbers you found on the graph.
- State your equilibrium price and quantity under your graph; be careful in correctly using the units of measurement indicated in the directions for this question.
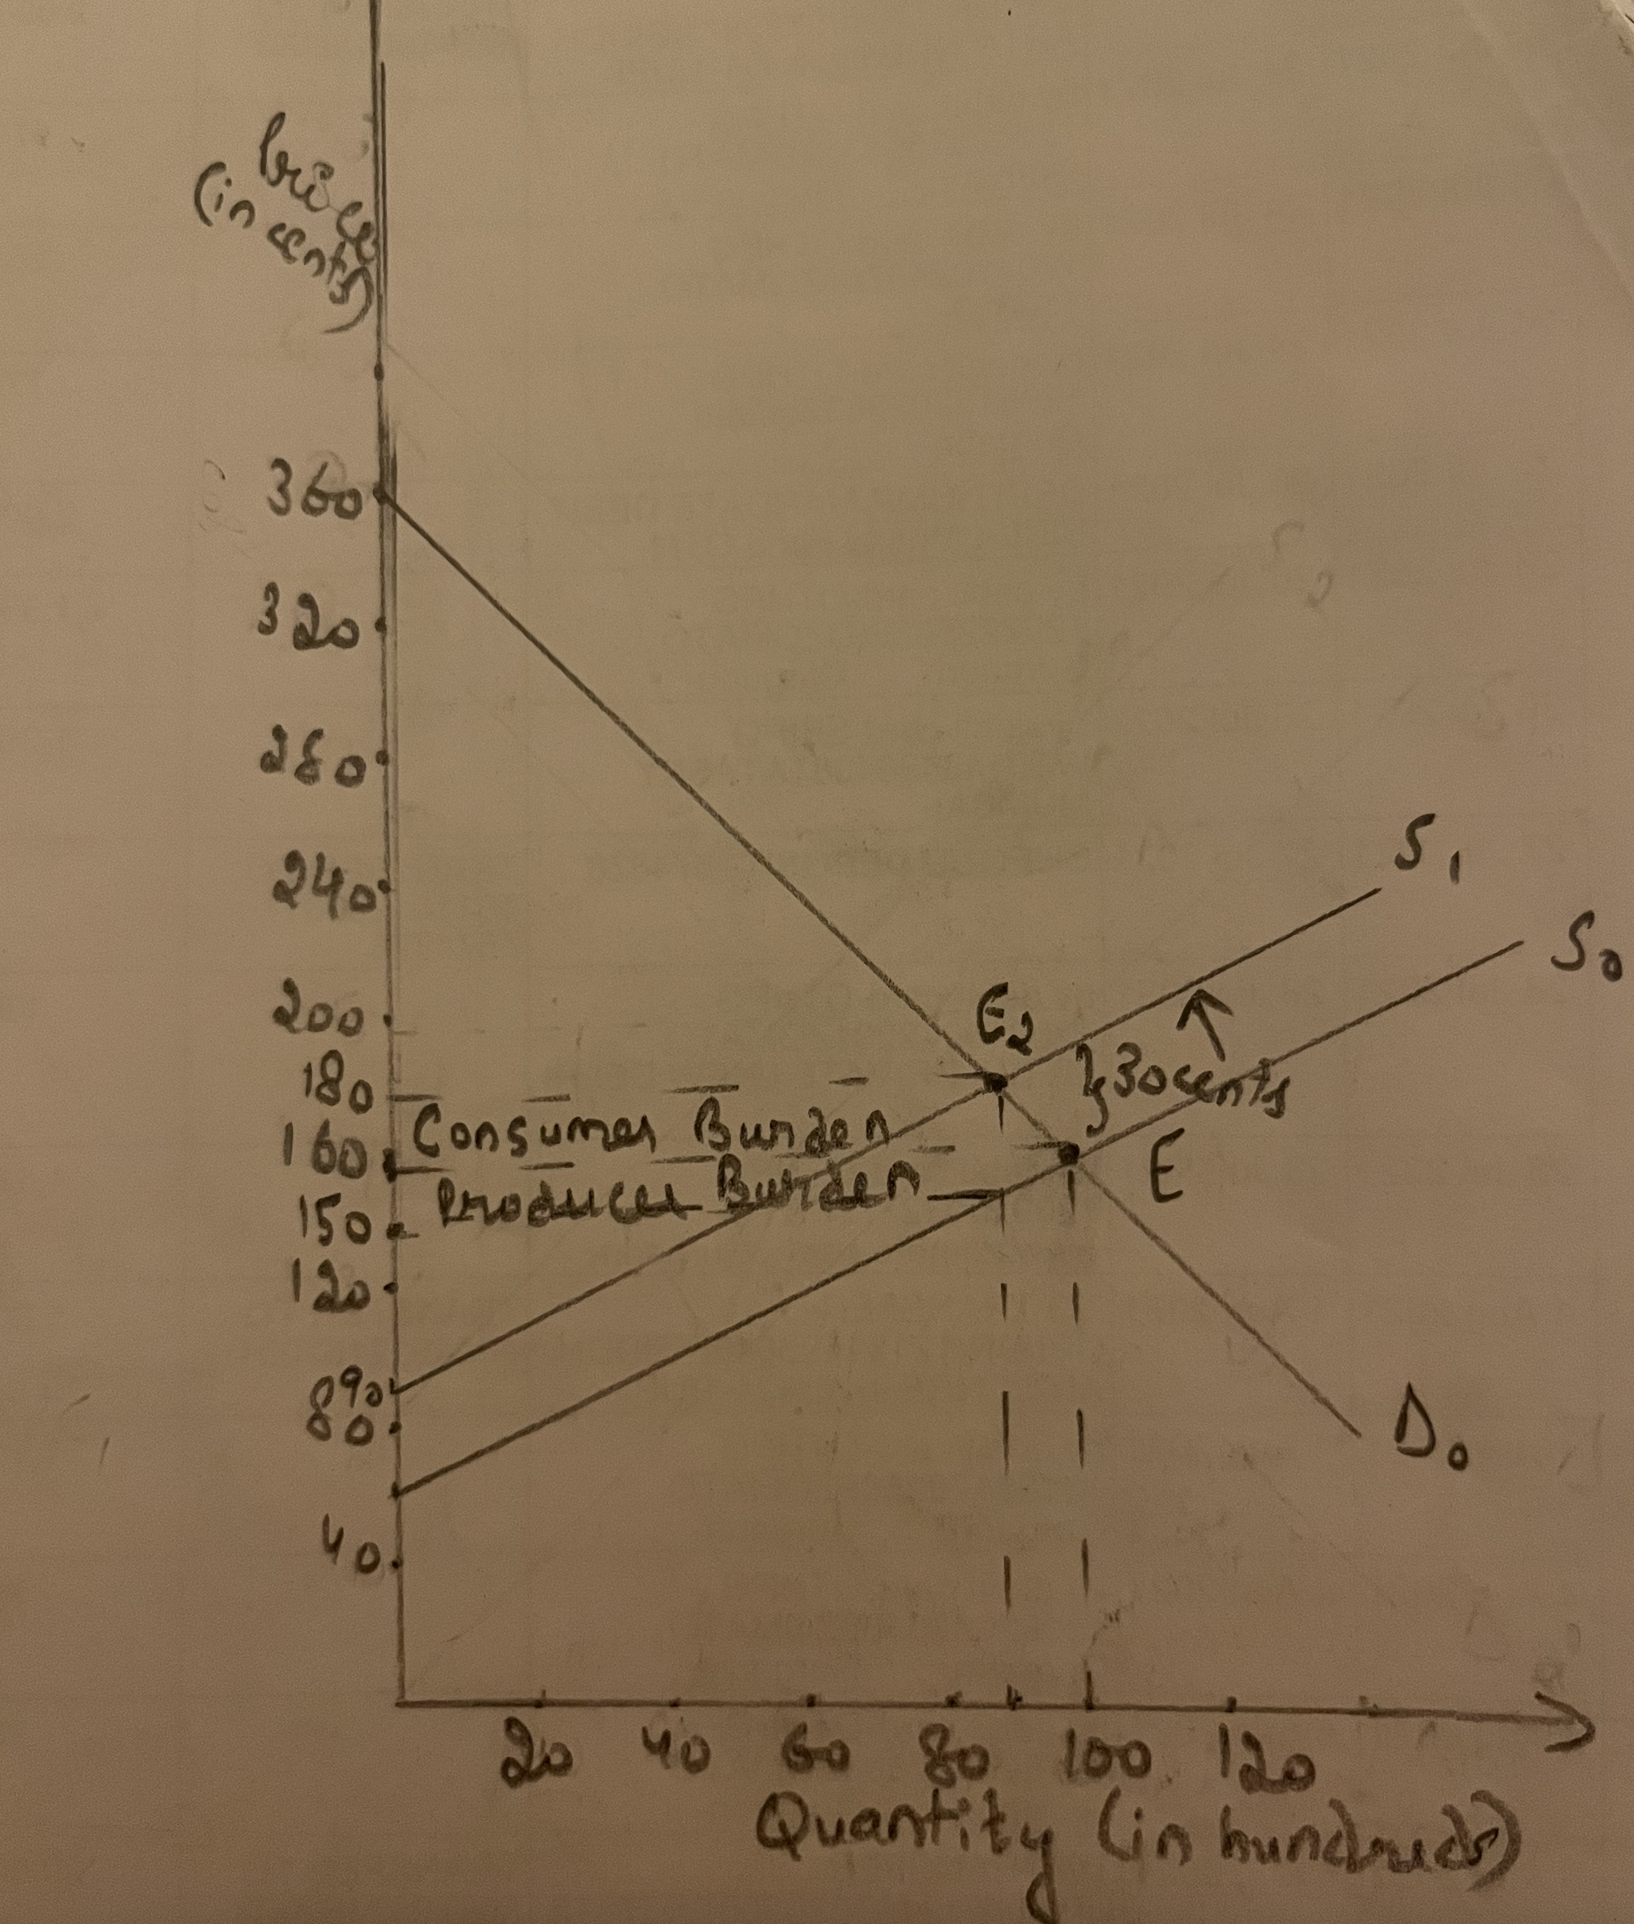

(in cents 360 320 280 S 240 So 62 200 4 30 sents 180 160 Consumer Burden E 1 1 Do 20 40 60 80 100 120 Quantity ( in hundreds)
Step by Step Solution
There are 3 Steps involved in it
1 Expert Approved Answer
Step: 1 Unlock

Question Has Been Solved by an Expert!
Get step-by-step solutions from verified subject matter experts
Step: 2 Unlock
Step: 3 Unlock