

Question: Can you please write the Description of the Problem from the case study given above? at least 250 words please just describe with theory, not
Can you please write the Description of the Problem from the case study given above? at least 250 words
please just describe with theory, not any solution.
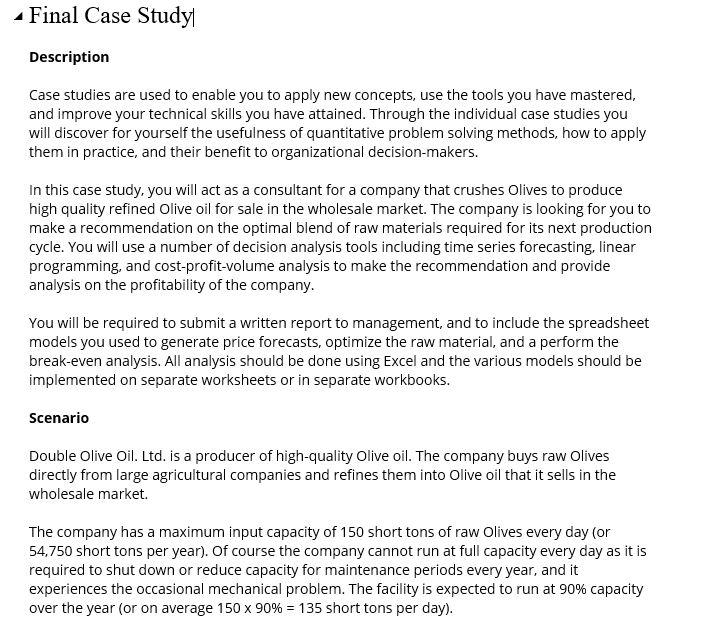
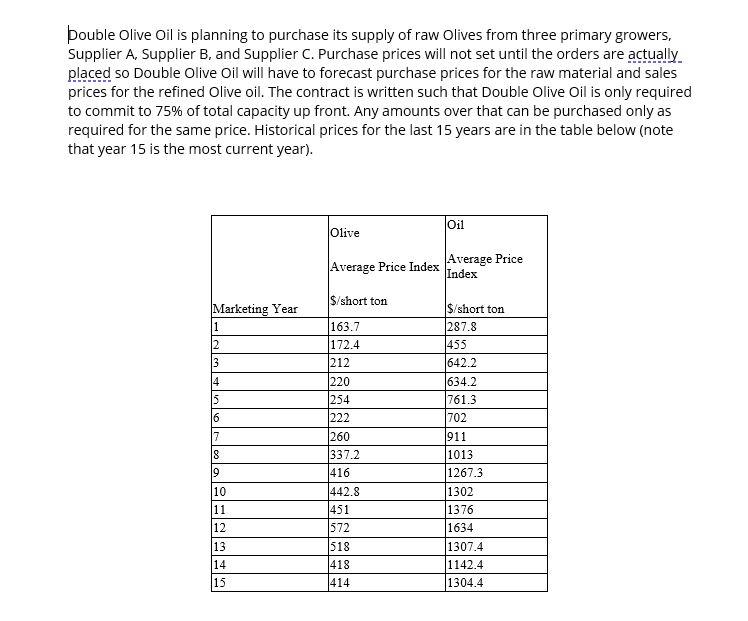
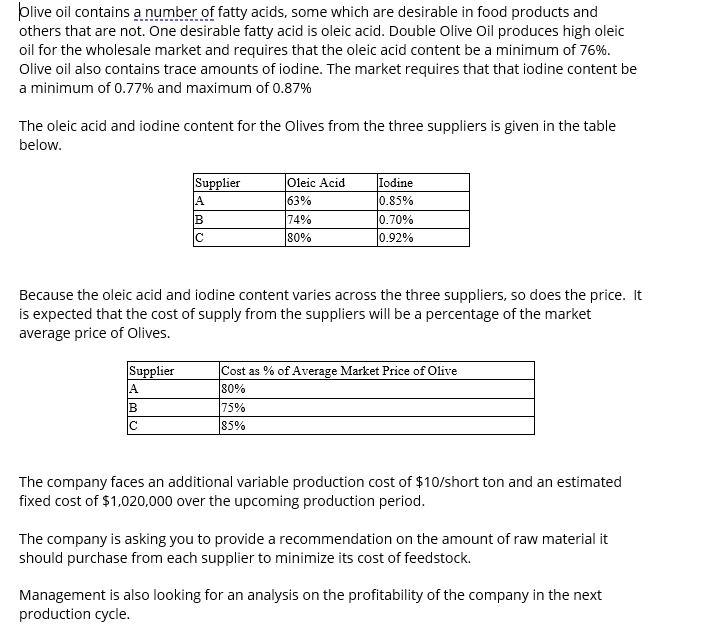
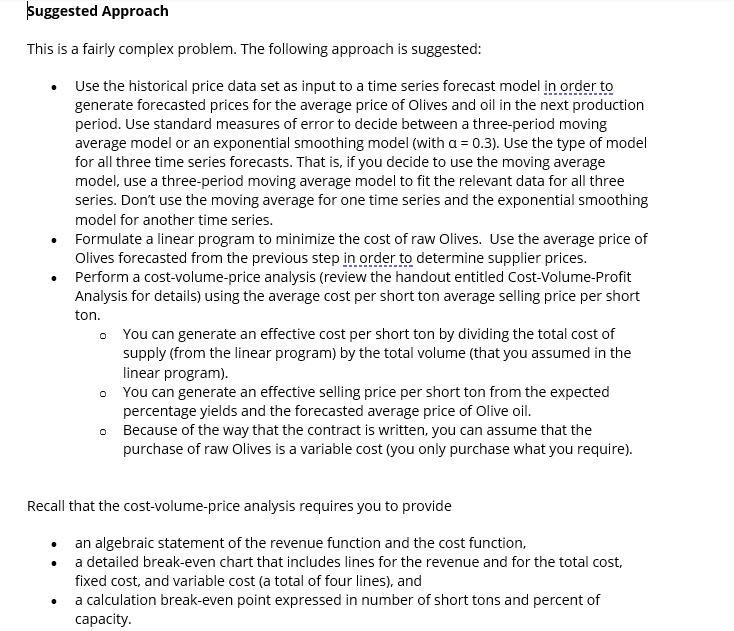
Final Case Study Description Case studies are used to enable you to apply new concepts, use the tools you have mastered, and improve your technical skills you have attained. Through the individual case studies you will discover for yourself the usefulness of quantitative problem solving methods, how to apply them in practice, and their benefit to organizational decision-makers. In this case study, you will act as a consultant for a company that crushes Olives to produce high quality refined Olive oil for sale in the wholesale market. The company is looking for you to make a recommendation on the optimal blend of raw materials required for its next production cycle. You will use a number of decision analysis tools including time series forecasting, linear programming, and cost-profit-volume analysis to make the recommendation and provide analysis on the profitability of the company. You will be required to submit a written report to management, and to include the spreadsheet models you used to generate price forecasts, optimize the raw material, and a perform the break-even analysis. All analysis should be done using Excel and the various models should be implemented on separate worksheets or in separate workbooks. Scenario Double Olive Oil. Ltd. is a producer of high-quality Olive oil. The company buys raw Olives directly from large agricultural companies and refines them into Olive oil that it sells in the wholesale market. The company has a maximum input capacity of 150 short tons of raw Olives every day (or 54,750 short tons per year). Of course the company cannot run at full capacity every day as it is required to shut down or reduce capacity for maintenance periods every year, and it experiences the occasional mechanical problem. The facility is expected to run at 90% capacity over the year (or on average 150 X 90% = 135 short tons per day). Double Olive Oil is planning to purchase its supply of raw Olives from three primary growers, Supplier A, Supplier B, and Supplier C. Purchase prices will not set until the orders are actually placed so Double Olive Oil will have to forecast purchase prices for the raw material and sales prices for the refined Olive oil. The contract is written such that Double Olive Oil is only required to commit to 75% of total capacity up front. Any amounts over that can be purchased only as required for the same price. Historical prices for the last 15 years are in the table below (note that year 15 is the most current year). Oil Olive Average Price Index Average Price Index $/short ton Marketing Year 1 2 3 14 5 16 7 8 9 163.7 172.4 212 220 254 222 260 337.2 416 442.8 451 572 518 418 414 $/short ton 287.8 455 642.2 1634.2 761.3 702 911 1013 1267.3 1302 1376 1634 1307.4 1142.4 10 11 12 13 14 15 1304.4 blive oil contains a number of fatty acids, some which are desirable in food products and others that are not. One desirable fatty acid is oleic acid. Double Olive Oil produces high oleic oil for the wholesale market and requires that the oleic acid content be a minimum of 76%. Olive oil also contains trace amounts of iodine. The market requires that that iodine content be a minimum of 0.77% and maximum of 0.87% The oleic acid and iodine content for the Olives from the three suppliers is given in the table below. Supplier A B Oleic Acid 63% 74% 80% Iodine 0.85% 0.70% 0.92% Because the oleic acid and iodine content varies across the three suppliers, so does the price. It is expected that the cost of supply from the suppliers will be a percentage of the market average price of Olives. Cost as % of Average Market Price of Olive Supplier A B 80% 75% 85% C The company faces an additional variable production cost of $10/short ton and an estimated fixed cost of $1,020,000 over the upcoming production period. The company is asking you to provide a recommendation on the amount of raw material it should purchase from each supplier to minimize its cost of feedstock. Management is also looking for an analysis on the profitability of the company in the next production cycle. suggested Approach This is a fairly complex problem. The following approach is suggested: Use the historical price data set as input to a time series forecast model in order to generate forecasted prices for the average price of Olives and oil in the next production period. Use standard measures of error to decide between a three-period moving average model or an exponential smoothing model (with a = 0.3). Use the type of model for all three time series forecasts. That is, if you decide to use the moving average model, use a three-period moving average model to fit the relevant data for all three series. Don't use the moving average for one time series and the exponential smoothing model for another time series. Formulate a linear program to minimize the cost of raw Olives. Use the average price of Olives forecasted from the previous step in order to determine supplier prices. Perform a cost-volume-price analysis (review the handout entitled Cost-Volume-Profit Analysis for details) using the average cost per short ton average selling price per short ton. You can generate an effective cost per short ton by dividing the total cost of supply (from the linear program) by the total volume (that you assumed in the linear program). You can generate an effective selling price per short ton from the expected percentage yields and the forecasted average price of Olive oil. Because of the way that the contract is written, you can assume that the purchase of raw Olives is a variable cost (you only purchase what you require). 0 Recall that the cost-volume-price analysis requires you to provide an algebraic statement of the revenue function and the cost function, a detailed break-even chart that includes lines for the revenue and for the total cost, fixed cost, and variable cost (a total of four lines), and a calculation break-even point expressed in number of short tons and percent of capacityStep by Step Solution
There are 3 Steps involved in it
1 Expert Approved Answer
Step: 1 Unlock

Question Has Been Solved by an Expert!
Get step-by-step solutions from verified subject matter experts
Step: 2 Unlock
Step: 3 Unlock