

Question: can you pleasedo from e to i i need answer starting from E to I thats all the information (1) (18 points) Recall that on
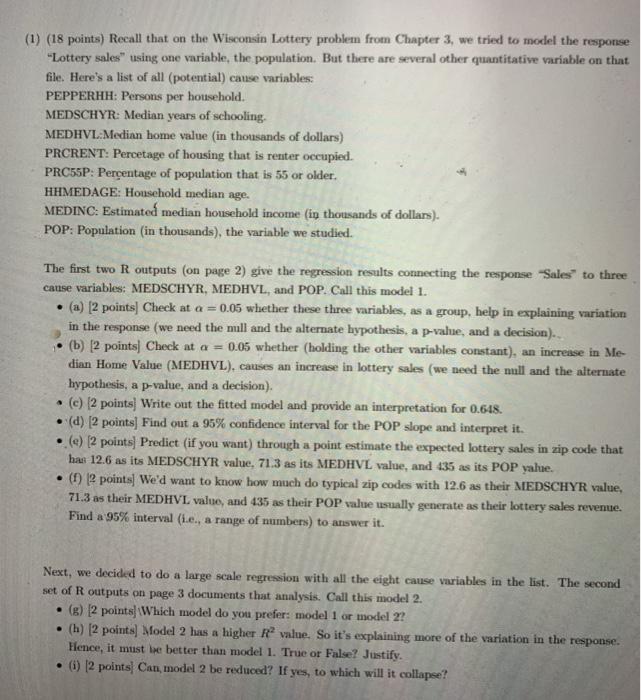
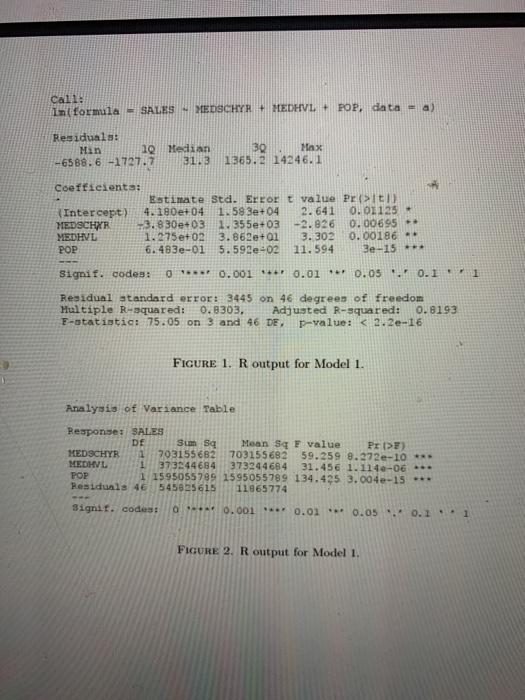
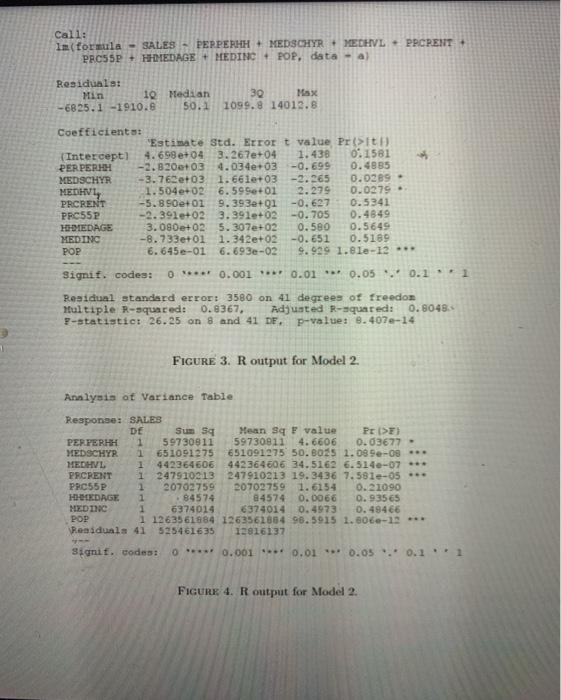
(1) (18 points) Recall that on the Wisconsin Lottery problem from Chapter 3, we tried to model the response "Lottery sales" using one variable, the population. But there are several other quantitative variable on that file. Here's a list of all (potential) cause variables PEPPERHH: Persons per household. MEDSCHYR: Median years of schooling. MEDHVL:Median home value in thousands of dollars) PRCRENT: Percetage of housing that is renter occupied. PRC5SP: Percentage of population that is 55 or older. HHMEDAGE: Household median age. MEDINC: Estimated median household income (in thousands of dollars). POP: Population (in thousands), the variable we studied. The first two R outputs on page 2) give the regression results connecting the response Sales" to three cause variables: MEDSCHYR, MEDHVL, and POP. Call this model 1. (a) (2 points Check at a = 0.05 whether these three variables, as a group, help in explaining variation in the response (we need the mill and the alternate hypothesis, a p-value, and a decision). (b) (2 points) Check at a = 0.05 whether (holding the other variables constant), an increase in Me dian Home Value (MEDHVL), causes an increase in lottery sales (we need the null and the alternate hypothesis, a p-value, and a decision) (c) (2 points) Write out the fitted model and provide an interpretation for 0.648. (d) (2 points) Find out a 95% confidence interval for the POP slope and interpret it. (e) (2 points) Predict (if you want) through a point estimate the expected lottery sales in zip code that has 12.6 as its MEDSCHYR value, 71.3 as its MEDHVL value, and 435 as its POP yalue. () 12 points) We'd want to know how much do typical zip codes with 12.6 as their MEDSCHYR value, 71.3 as their MEDHVL value, and 435 as their POP value usually generate as their lottery sales revenue. Find a 95% interval (i.c., a range of numbers) to answer it. Next, we decided to do a large scale regression with all the eight cause variables in the list. The second set of R outputs on page 3 documents that analysis. Call this model 2. . (B) (2 points (Which model do you prefer: model 1 or model 2! (h) [2 points) Model 2 has a higher R value. So it's explaining more of the variation in the response. Hence, it must be better than model 1. True or False? Justify. . (1) (2 points Can, model 2 be reduced? If yes, to which will it collapse? Cal1 in formula = SALES MEDSCHYR MEDHVL + POP, data) Residuals: Min 1 Median -6588.6 -1727.7 31.3 30 Max 1365.214246.1 Coefficienta: Estimate Std. Error t value Peti) (Intercept) 4.190e+04 1.583e+04 2. 641 0.01125 MEDSCHIR -3.830e+03 1.355e+03 - 2.826 0.00695 - MEDHVL 1.275e+02 3.862e+01 3. 302 0.00186 - POP 6.483e-01 5.592e-02 11.594 3e-15 +++ Signif. codes: 0 0.001 +++ 0.01 ** 0.05 0.11 Residual standard error: 3445 on 46 degrees of freedom Haltiple R-squared: 0.8303, Adjusted R-squared: 0.8193 E-statistic: 75.05 on 3 and 46 DE, p-value: E PER PERHH 1 59730811 59730811 4.6606 0.03677 - MEDSCHYR 1 651091275 651091275 50.B015 1.099-09 HEDHVL 1 442364606 442364606 34.5162 6.514-07 *** PRCRENT 1 247910213 247910213 19.3436 7.581-05 - PRC55P 1 20702759 20702759 1.6154 0.21090 HORDAGE 84574 84574 0.0066 0.935 65 MEDIC 1 6374014 6374014 0.4973 0.49466 POP 1 1263561884 1263561854 96.5915 1. 806-13 *** Residuals 41 525461635 12916137 Signif. codes: O**** 0.001 0.01 0.05.0.1 FIGURE 4. R output for Model 2
Step by Step Solution
There are 3 Steps involved in it

Get step-by-step solutions from verified subject matter experts