

Question: can you show how to do the steps ( guide) so I know how to do it please! Step Instructions Point Value 1 0 Start
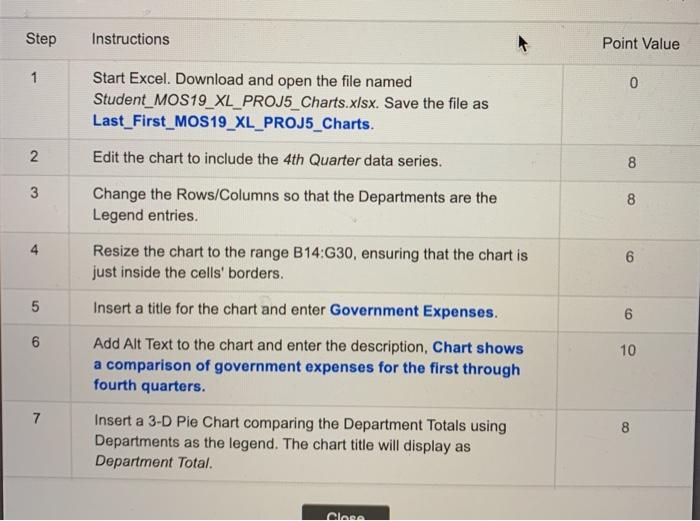
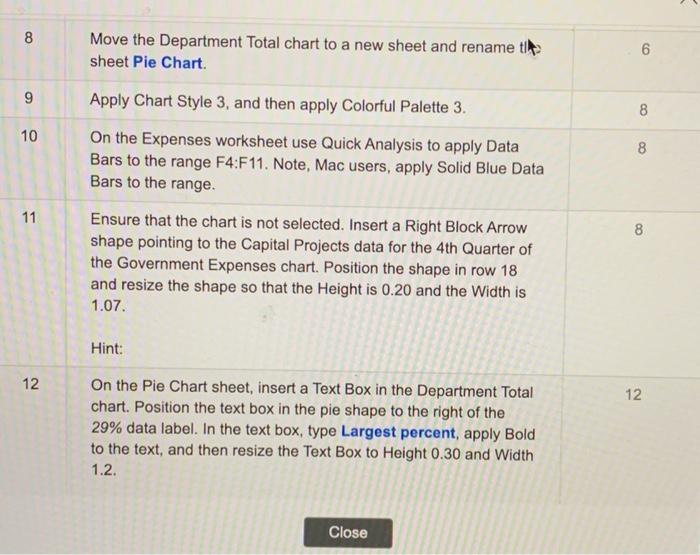
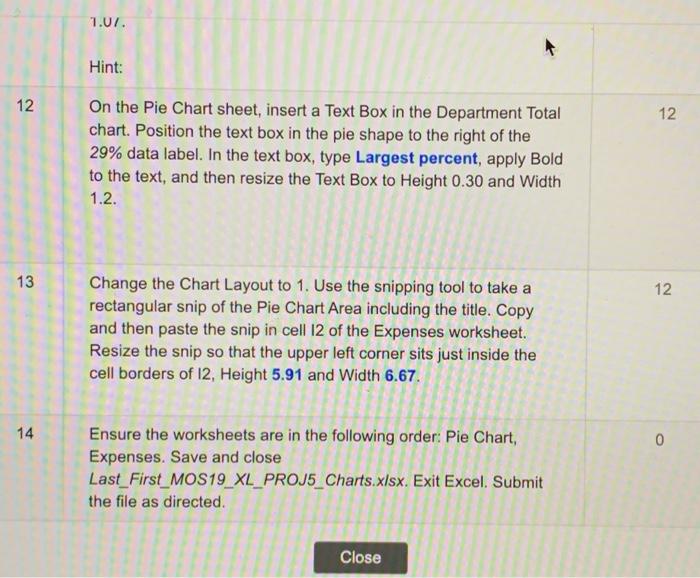
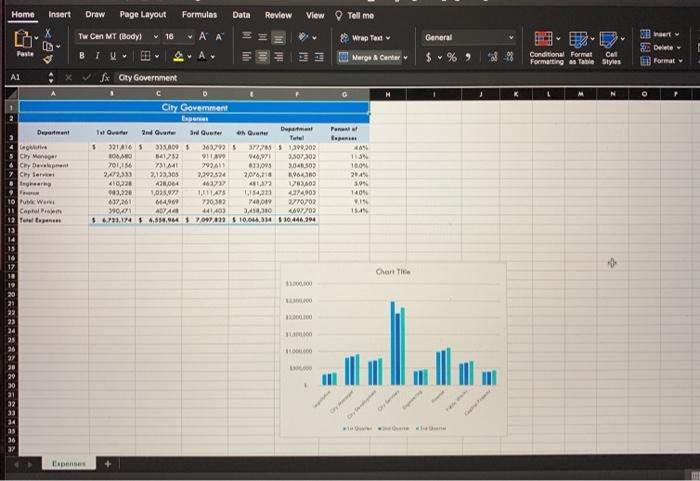
Step Instructions Point Value 1 0 Start Excel. Download and open the file named Student_MOS19_XL_PROJ5_Charts.xlsx. Save the file as Last_First_MOS19_XL_PROJ5_Charts. Edit the chart to include the 4th Quarter data series. N 8 8 3 8 Change the Rows/Columns so that the Departments are the Legend entries. 4 Resize the chart to the range B14:30, ensuring that the chart is just inside the cells' borders. 6 5 5 Insert a title for the chart and enter Government Expenses. 6 6 CO 10 Add Alt Text to the chart and enter the description, Chart shows a comparison of government expenses for the first through fourth quarters. 8 Insert a 3-D Pie Chart comparing the Department Totals using Departments as the legend. The chart title will display as Department Total. Clans 8 Move the Department Total chart to a new sheet and rename tim sheet Pie Chart. 6 9 Apply Chart Style 3, and then apply Colorful Palette 3. 8 10 8 8 On the Expenses worksheet use Quick Analysis to apply Data Bars to the range F4:F11. Note, Mac users, apply Solid Blue Data Bars to the range. 11 8 Ensure that the chart is not selected. Insert a Right Block Arrow shape pointing to the Capital Projects data for the 4th Quarter of the Government Expenses chart. Position the shape in row 18 and resize the shape so that the Height is 0.20 and the Width is 1.07. Hint: 12 12 On the Pie Chart sheet, insert a Text Box in the Department Total chart. Position the text box in the pie shape to the right of the 29% data label. In the text box, type Largest percent, apply Bold to the text, and then resize the Text Box to Height 0.30 and Width 1.2. Close 1.07. Hint: 12 12 On the Pie Chart sheet, insert a Text Box in the Department Total chart. Position the text box in the pie shape to the right of the 29% data label. In the text box, type Largest percent, apply Bold to the text, and then resize the Text Box to Height 0.30 and Width 1.2. 13 12 Change the Chart Layout to 1. Use the snipping tool to take a rectangular snip of the Pie Chart Area including the title. Copy and then paste the snip in cell 12 of the Expenses worksheet. Resize the snip so that the upper left corner sits just inside the cell borders of 12, Height 5.91 and Width 6.67. 14 0 Ensure the worksheets are in the following order: Pie Chart, Expenses. Save and close Last_First_MOS19_XL_PROJ5_Charts.xlsx. Exit Excel. Submit the file as directed. Close Home Insert Draw Page Layout Formulas Data Review View Tell me X Tw Can MT (Body) 16 29 Wrap Toe ~ A General $ % ver Delete Format A BTU :313 Marge & Center 8 9 Conditional Format Cell Formatting as Table Styles Al X Sx Oty Government O City Government Department Porn apen 16V L'or Cry Men Chy Development Cyfer Degree 3rd Quarter eh Qian Dep Tale 5 321416 5 335.000 $363735 372 1290,202 100MO 1417 1 3.507302 2011 7314 792411 13,00 3D4ESO) 2.072,333 3,122305 2,292.324 2076,715 410,220 43064 460 481,2222 093,220 1,025.971 1114 1.1543 174003 637,261 6149 720 382 748,00 2770702 3106 441403 3.450,310 460702 56.733.174 16,514,647023810.044,314810446.294 0096 cov 180 2849 304 140 IS 114 Pue Wer 11 Caphar 12 Tapete Chart Title 10 19 20 21 22 PE SE ... 26 27 30 20 30 IE ZE 33 34 35 Expenses
Step by Step Solution
There are 3 Steps involved in it

Get step-by-step solutions from verified subject matter experts