

Question: Can you solve using excel? Consider the two stocks below. Graph the frontier of combinations of the two stocks. Show the effect on the frontier
Can you solve using excel?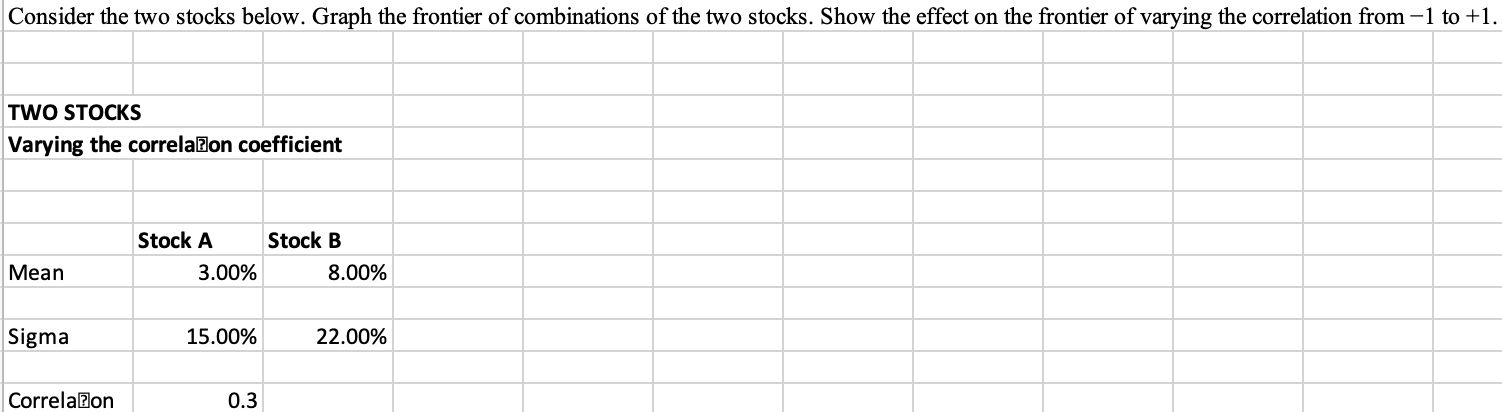
Consider the two stocks below. Graph the frontier of combinations of the two stocks. Show the effect on the frontier of varying the correlation from 1 to +1. TWO STOCKS Varying the correlafon coefficient Stock A Stock B 3.00% 8.00% Mean Sigma 15.00% 22.00% Correlafon 0.3
Step by Step Solution
There are 3 Steps involved in it
1 Expert Approved Answer
Step: 1 Unlock

Question Has Been Solved by an Expert!
Get step-by-step solutions from verified subject matter experts
Step: 2 Unlock
Step: 3 Unlock