

Question: cant post the norcal file. use python. also, the average is wrong. the first picture is the question. I havent done any. the code i
cant post the norcal file.
use python. also, the average is wrong. the first picture is the question. I havent done any. the code i got is from previous assignment related to this question.
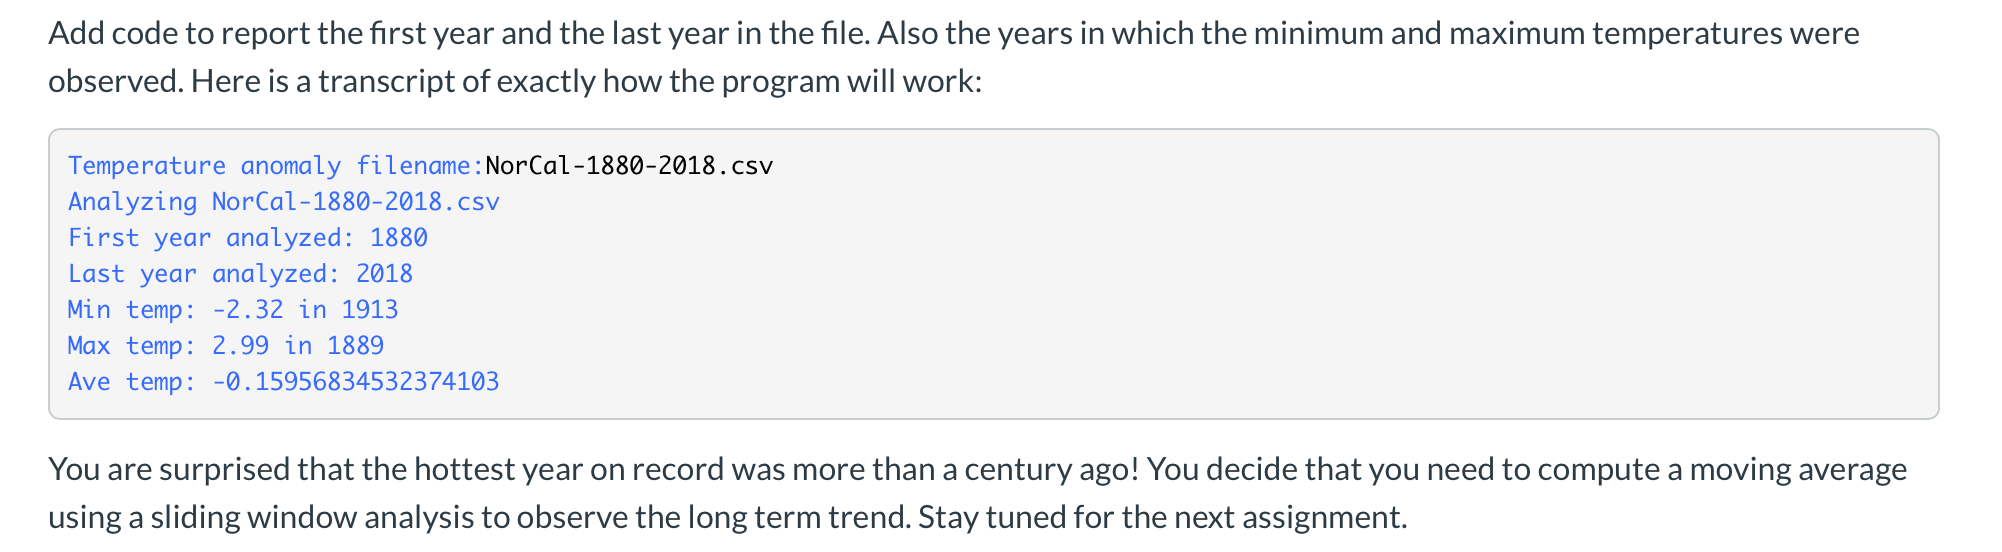
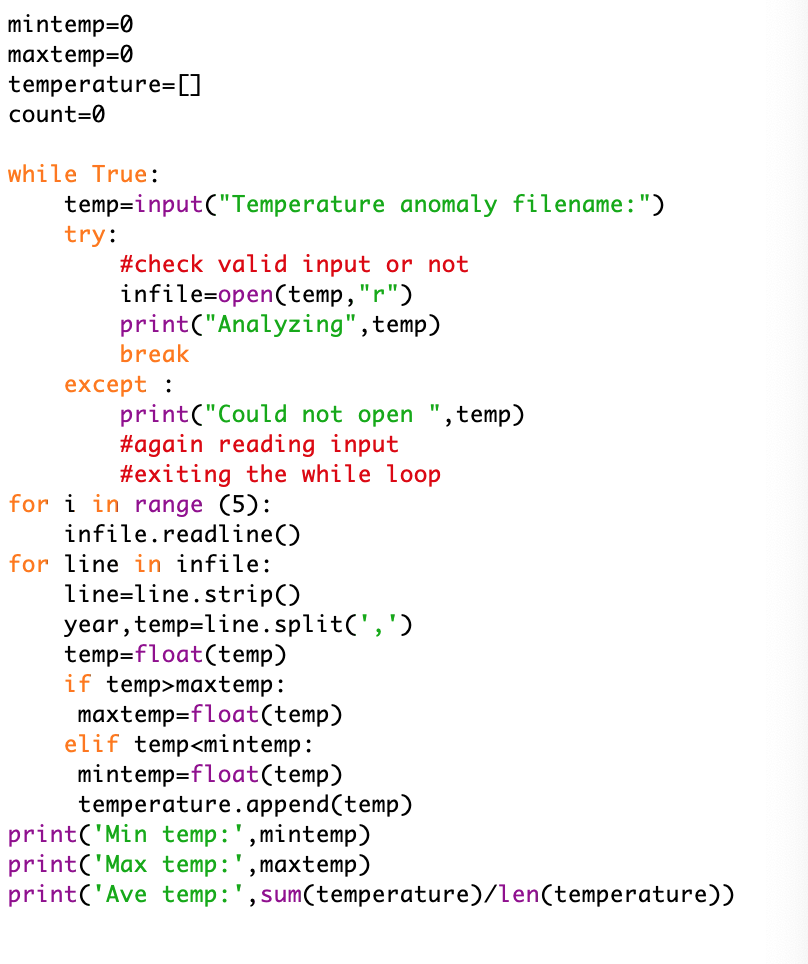
Add code to report the first year and the last year in the file. Also the years in which the minimum and maximum temperatures were observed. Here is a transcript of exactly how the program will work: Temperature anomaly filename: NorCal-1880-2018.csv Analyzing NorCal-1880-2018.csv First year analyzed: 1880 Last year analyzed: 2018 Min temp: -2.32 in 1913 Max temp: 2.99 in 1889 Ave temp: -0.15956834532374103 You are surprised that the hottest year on record was more than a century ago! You decide that you need to compute a moving average using a sliding window analysis to observe the long term trend. Stay tuned for the next assignment. mintemp=0 maxtemp=0 temperature=[] count=0 while True: temp=input("Temperature anomaly filename:") try: #check valid input or not infile=open(temp, "r") print("Analyzing", temp) break except : print("Could not open ", temp) #again reading input #exiting the while loop for i in range (5): infile.readline() for line in infile: line=line.strip() year, temp=line.split(',') temp=float(temp) if temp>maxtemp: maxtemp=float(temp) elif temp
Step by Step Solution
There are 3 Steps involved in it

Get step-by-step solutions from verified subject matter experts