

Question: Canvas as a single pdf file 8.2 Question 3. The following graphs show the production possibilities curves for France and Italy: 20 points Cheese France
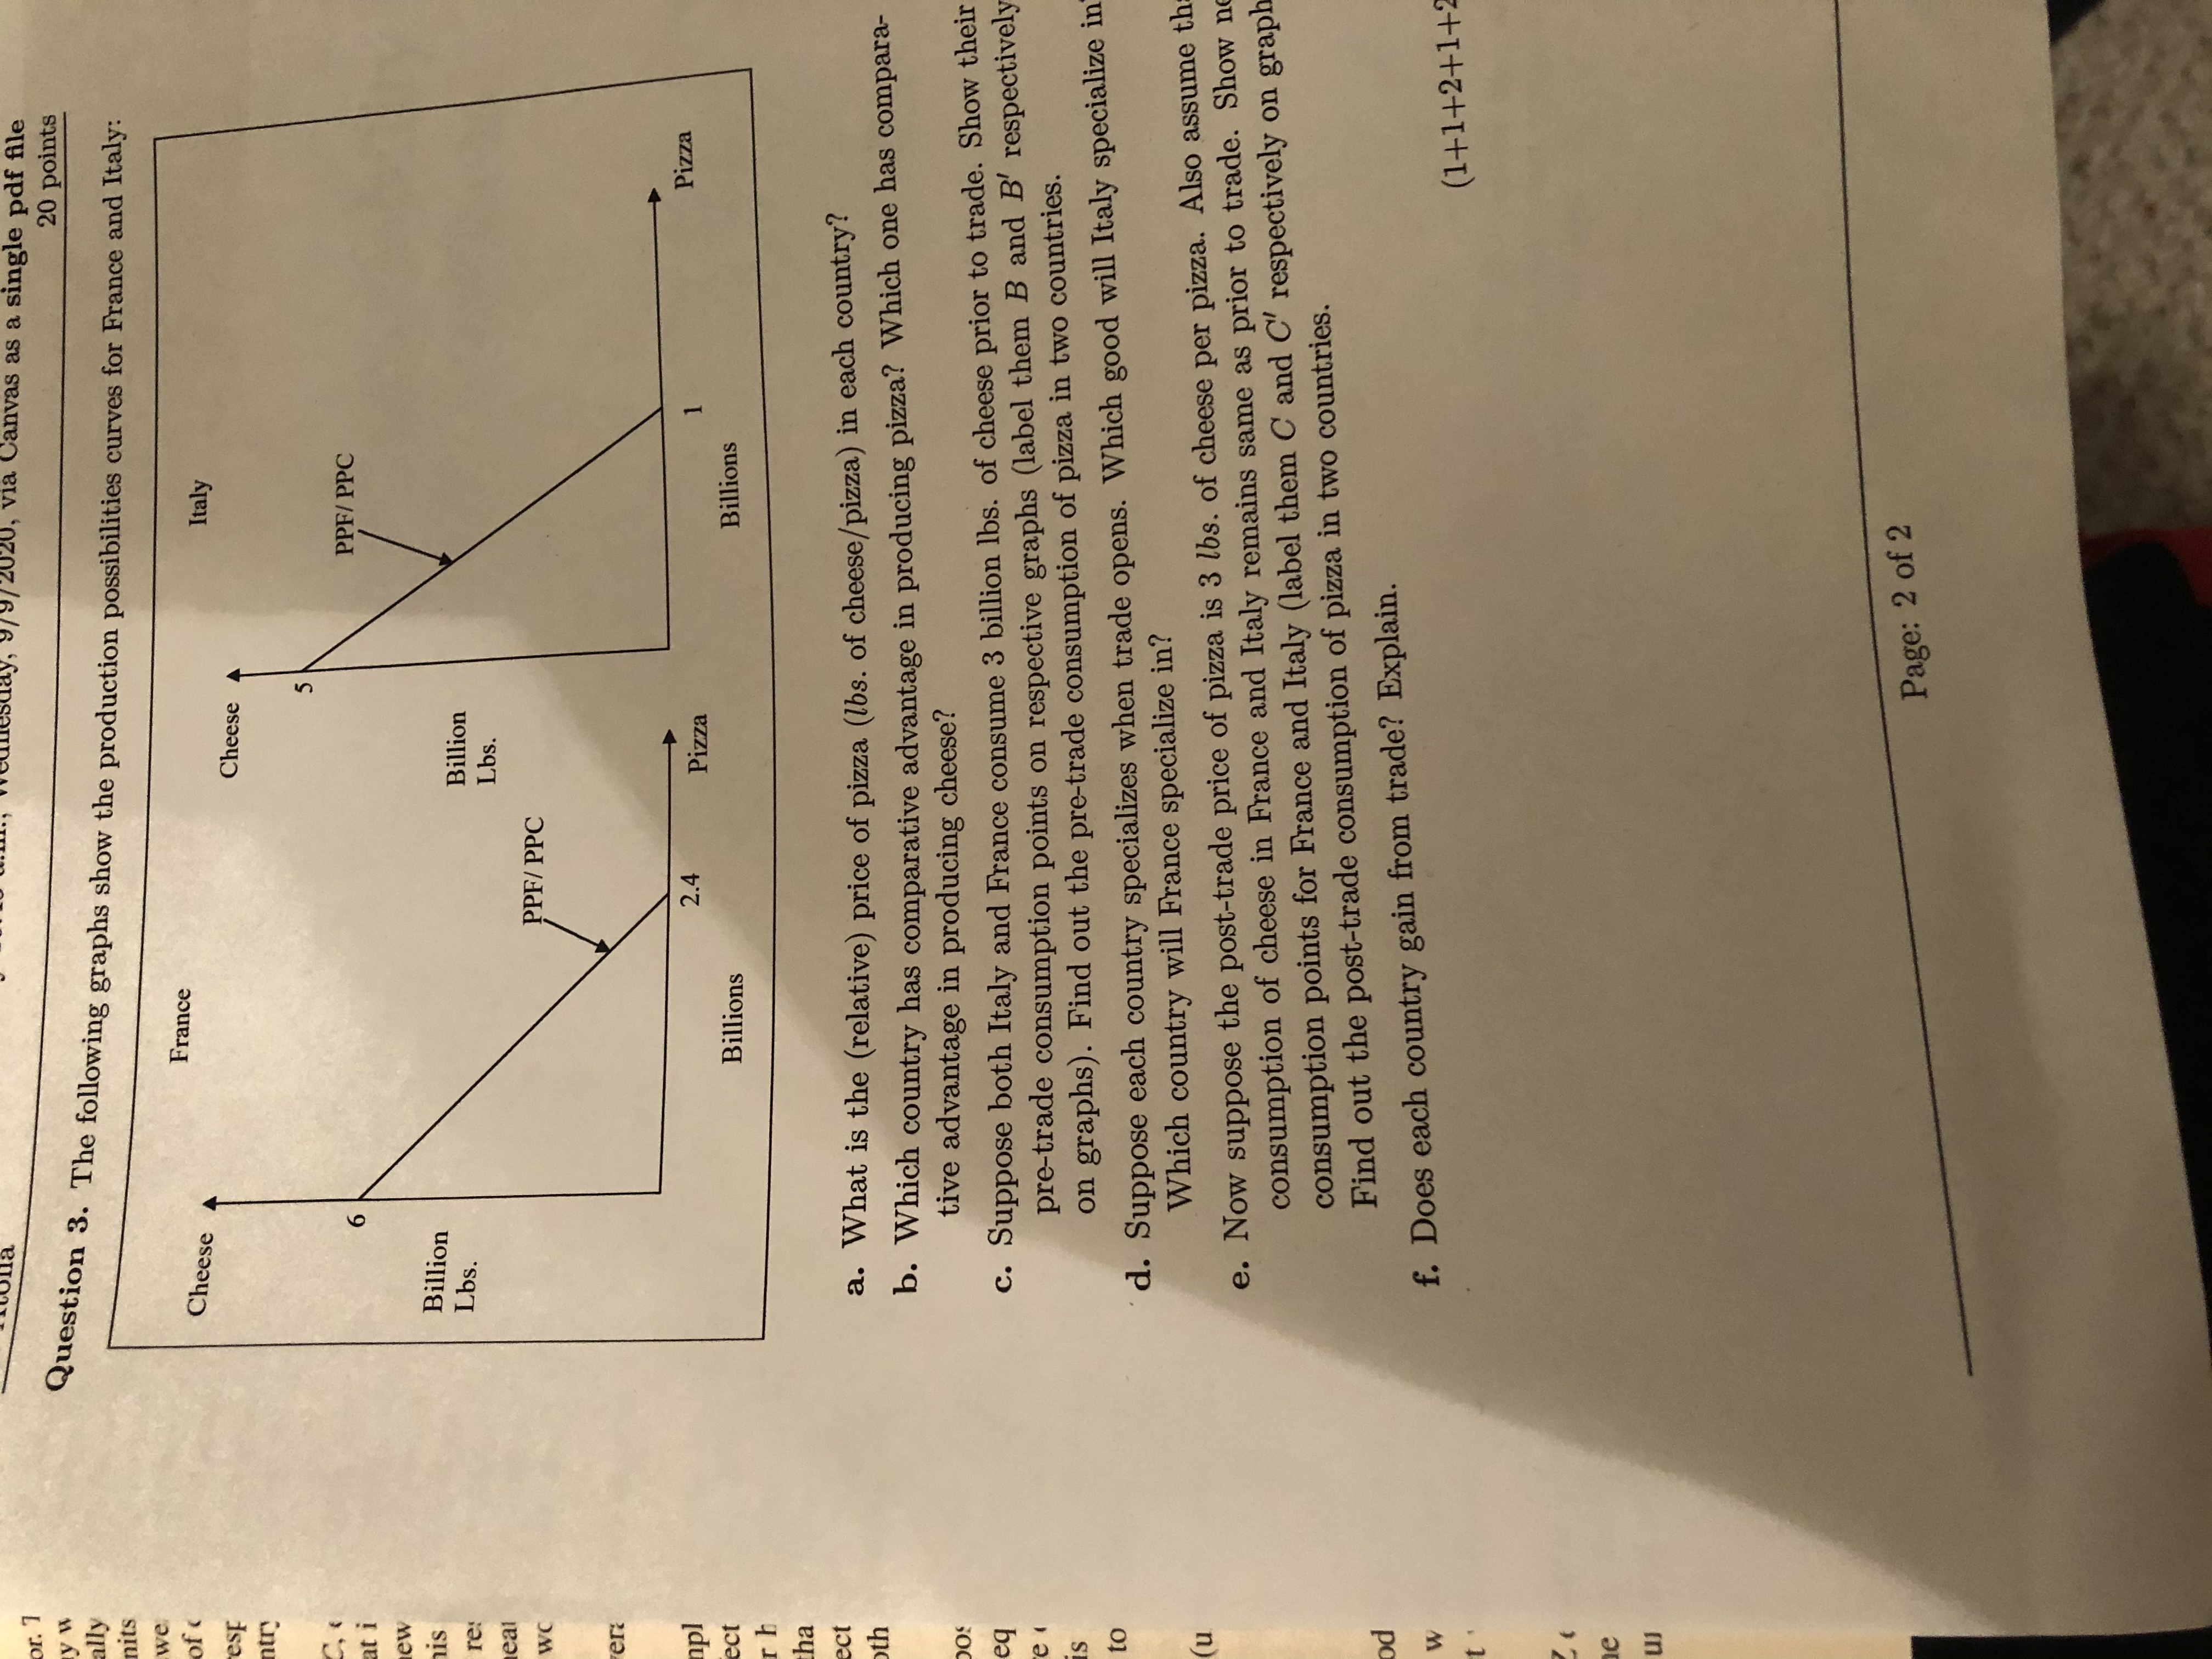
Canvas as a single pdf file 8.2 Question 3. The following graphs show the production possibilities curves for France and Italy: 20 points Cheese France Italy Cheese in PPF/ PPC Billion Lbs. Billion Lbs. PPF/ PPC 2.4 Pizza Pizza Billions Billions a. What is the (relative) price of pizza (lbs. of cheese/pizza) in each country? b. Which country has comparative advantage in producing pizza? Which one has compara- tive advantage in producing cheese? c. Suppose both Italy and France consume 3 billion lbs. of cheese prior to trade. Show their pre-trade consumption points on respective graphs (label them B and B' respectively on graphs). Find out the pre-trade consumption of pizza in two countries. d. Suppose each country specializes when trade opens. Which good will Italy specialize in Which country will France specialize in? e. Now suppose the post-trade price of pizza is 3 lbs. of cheese per pizza. Also assume th consumption of cheese in France and Italy remains same as prior to trade. Show n consumption points for France and Italy (label them C and C' respectively on graph Find out the post-trade consumption of pizza in two countries. f. Does each country gain from trade? Explain. (1+1+2+1+2 Page: 2 of 2
Step by Step Solution
There are 3 Steps involved in it

Get step-by-step solutions from verified subject matter experts