Question: Capacity Analysis Capacity Analysis Being able to analyze plant and equipment (capacity and automation) is essential to understanding how you and your competitors are supplying
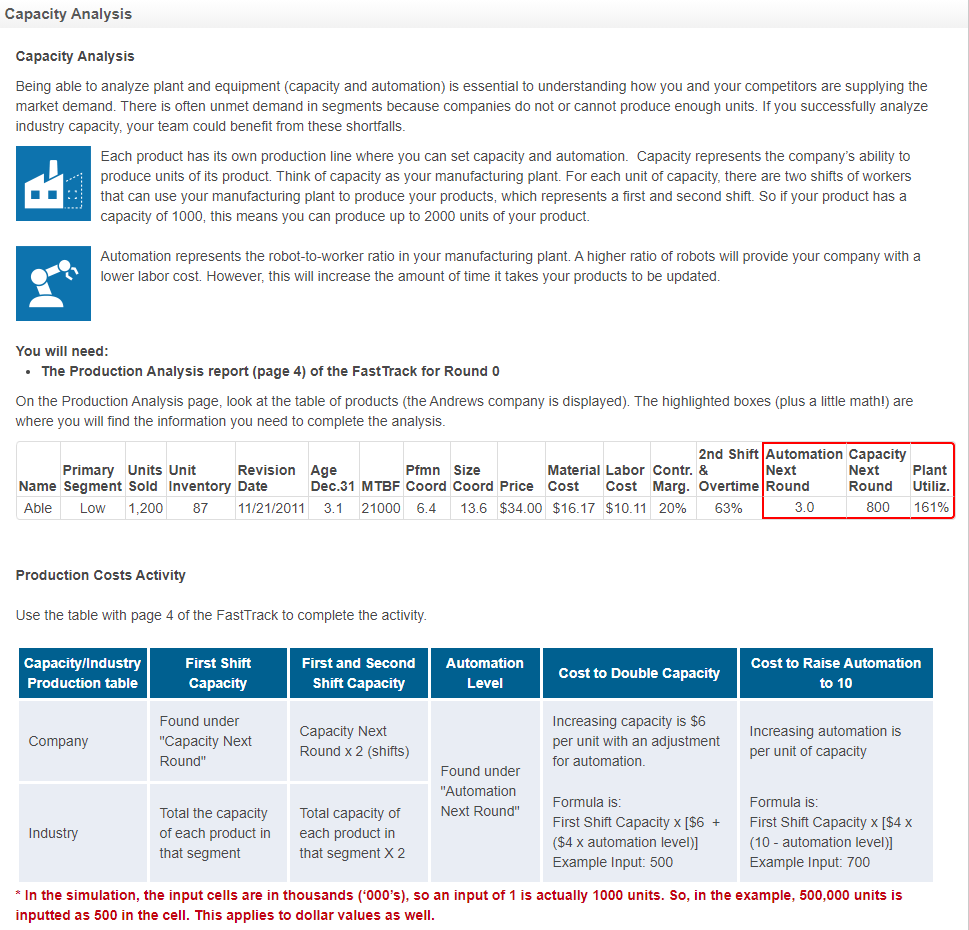
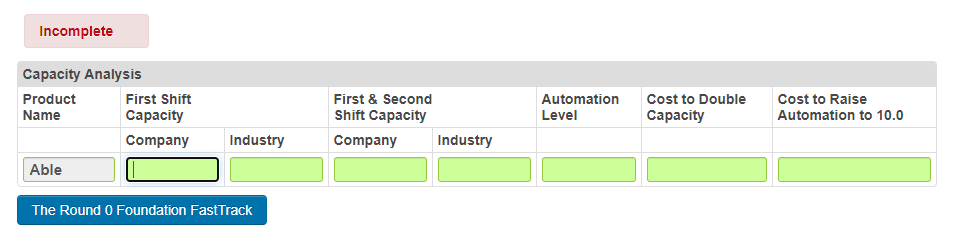
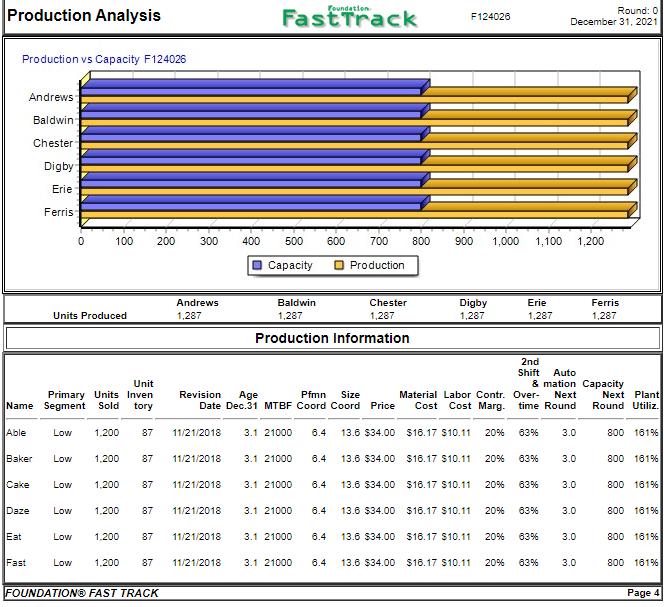
Capacity Analysis Capacity Analysis Being able to analyze plant and equipment (capacity and automation) is essential to understanding how you and your competitors are supplying the market demand. There is often unmet demand in segments because companies do not or cannot produce enough units. If you successfully analyze industry capacity, your team could benefit from these shortfalls. Each product has its own production line where you can set capacity and automation. Capacity represents the company's ability to produce units of its product. Think of capacity as your manufacturing plant. For each unit of capacity, there are two shifts of workers that can use your manufacturing plant to produce your products, which represents a first and second shift. So if your product has a capacity of 1000, this means you can produce up to 2000 units of your product. Automation represents the robot-to-worker ratio in your manufacturing plant. A higher ratio of robots will provide your company with a lower labor cost. However, this will increase the amount of time it takes your products to be updated. You will need: The Production Analysis report (page 4) of the Fast Track for Round 0 On the Production Analysis page, look at the table of products (the Andrews company is displayed). The highlighted boxes (plus a little math!) are where you will find the information you need to complete the analysis. 2nd Shift Automation Capacity Primary Units Unit Revision Age Pfmn Size Material Labor Contr. & Next Next Plant Name Segment Sold Inventory Date Dec.31 MTBF Coord Coord Price Cost Cost Marg. Overtime Round Round Utiliz. Low 1,200 87 11/21/2011 3.1 21000 6.4 13.6 $34.00 $16.17 $10.11 20% 63% 3.0 800 161% Able Production Costs Activity Use the table with page 4 of the FastTrack to complete the activity. Capacity/Industry Production table First Shift Capacity First and Second Shift Capacity Automation Level Cost to Double Capacity Cost to Raise Automation to 10 Found under "Capacity Next Round" Capacity Next Company Increasing capacity is $6 per unit with an adjustment for automation Round x 2 (shifts) Increasing automation is per unit of capacity Found under "Automation Next Round" Industry Total the capacity of each product in that segment Total capacity of each product in that segment X 2 Formula is: First Shift Capacity x [$6 + ($4 x automation level)] Example Input: 500 Formula is: First Shift Capacity x [$4 X (10 - automation level)] Example Input: 700 * In the simulation, the input cells are in thousands ('000's), so an input of 1 is actually 1000 units. So, in the example, 500,000 units is inputted as 500 in the cell. This applies to dollar values as well. Incomplete Automation Level Capacity Analysis Product First Shift Name Capacity Company Able First & Second Shift Capacity Company Cost to Double Capacity Cost to Raise Automation to 10.0 Industry Industry The Round 0 Foundation Fast Track foundation Production Analysis Fast Track F124026 Round: 0 December 31, 2021 Production vs Capacity F124026 Andrews Baldwin Chester Digby Erie Ferris 0 100 200 300 400 500 600 700 800 900 1,000 1,100 1,200 Capacity O Production Andrews 1,287 Baldwin 1,287 Chester 1,287 Digby 1,287 Erie 1,287 Ferris 1,287 Units Produced Production Information Unit Primary Units Inven Name Segment Sold tory 2nd Shift Auto & mation Capacity Revision Age Pfmn Size Material Labor Contr. Over- Next Next Plant Date Dec.31 MTBF Coord Coord Price Cost Cost Marg. time Round Round Utiliz. Able Low 1.200 87 11/21/2018 3.1 21000 6.4 13.6 $34.00 $16.17 $10.11 20% 63% 3.0 800 1019 Baker Low 1.200 87 11/21/2018 3.1 21000 6.4 13.6 $34.00 $16.17 $10.11 20% 6396 3.0 800 16196 Cake Low 1.200 87 11/21/2018 3.1 21000 6.4 13.6 $34.00 $16.17 $10.11 2096 63% 3.0 800 161% Daze Low 1.200 87 11/21/2018 3.1 21000 6.4 13.6 $34.00 $16.17 $10.11 20% 63% 3.0 800 181% Eat Low 1.200 87 11/21/2018 3.1 21000 6.4 13.6 $34.00 $16.17 $10.11 20% 63% 3.0 800 181% Fast Low 1.200 87 11/21/2018 3.1 21000 6.4 13.6 $34.00 $16.17 $10.11 2096 6396 3.0 800 181% FOUNDATION FAST TRACK Page 4


