

Question: CAPM predicts that a security's risk premium increase in proportion to its beta of the security, not its volatility. Justify this statement using Figures 10.6
CAPM predicts that a security's risk premium increase in proportion to its beta of the security, not its volatility. Justify this statement using Figures 10.6 and 10.7 in Chapter 10.
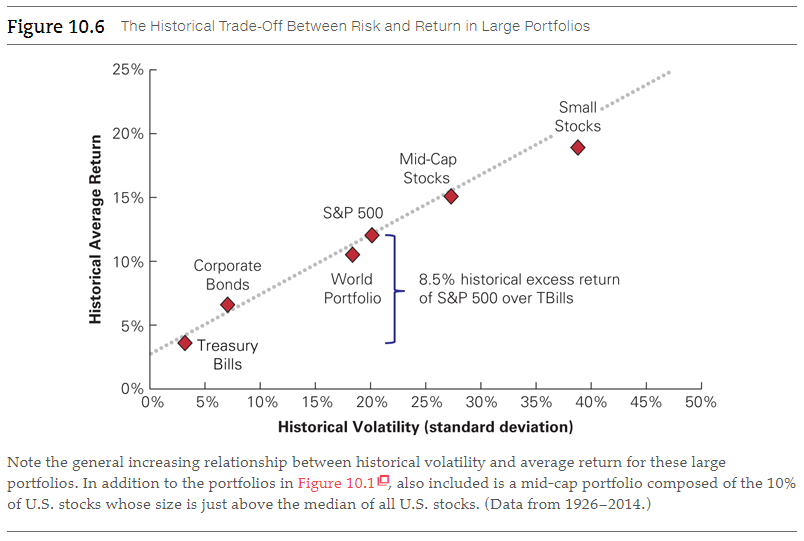
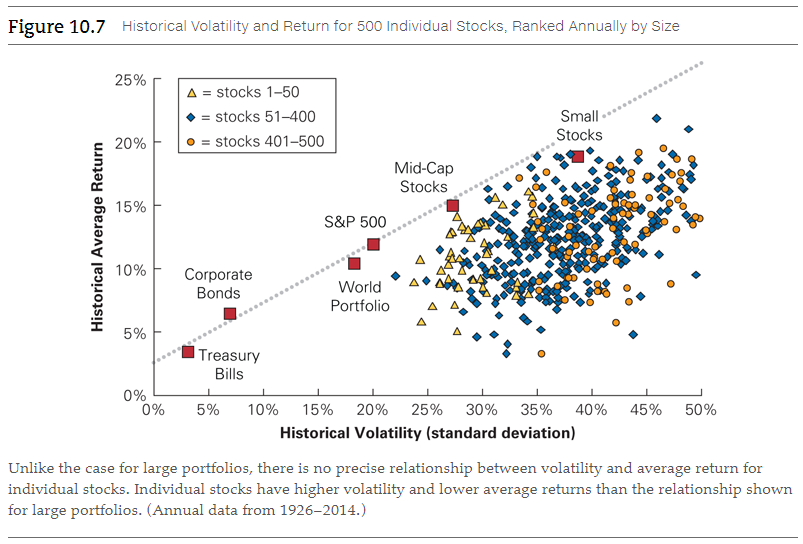
Figure 10.6 The Historical Trade-off Between Risk and Return in Large Portfolios 25% Small Stocks 20% Mid-Cap Stocks 15% S&P 500 Historical Average Return 10% Corporate Bonds World Portfolio 8.5% historical excess return of S&P 500 over TBills 5% Treasury Bills 1 1 0% 0% 5% 45% 50% 10% 15% 20% 25% 30% 35% 40% Historical Volatility (standard deviation) Note the general increasing relationship between historical volatility and average return for these large portfolios. In addition to the portfolios in Figure 10.1, also included is a mid-cap portfolio composed of the 10% of U.S. stocks whose size is just above the median of all U.S. stocks. (Data from 1926-2014.) Figure 10.7 Historical Volatility and Return for 500 Individual Stocks, Ranked Annually by Size 25% A = stocks 1-50 = stocks 51-400 = stocks 401-500 Small Stocks 20% Mid-Cap Stocks 15% S&P 500 Historical Average Return 10% Corporate Bonds World Portfolio A 5% Treasury Bills 0% 0% 5% 10% 15% 20% 25% 30% 35% 40% 45% 50% Historical Volatility (standard deviation) Unlike the case for large portfolios, there is no precise relationship between volatility and average return for individual stocks. Individual stocks have higher volatility and lower average returns than the relationship shown for large portfolios. (Annual data from 1926-2014.) Figure 10.6 The Historical Trade-off Between Risk and Return in Large Portfolios 25% Small Stocks 20% Mid-Cap Stocks 15% S&P 500 Historical Average Return 10% Corporate Bonds World Portfolio 8.5% historical excess return of S&P 500 over TBills 5% Treasury Bills 1 1 0% 0% 5% 45% 50% 10% 15% 20% 25% 30% 35% 40% Historical Volatility (standard deviation) Note the general increasing relationship between historical volatility and average return for these large portfolios. In addition to the portfolios in Figure 10.1, also included is a mid-cap portfolio composed of the 10% of U.S. stocks whose size is just above the median of all U.S. stocks. (Data from 1926-2014.) Figure 10.7 Historical Volatility and Return for 500 Individual Stocks, Ranked Annually by Size 25% A = stocks 1-50 = stocks 51-400 = stocks 401-500 Small Stocks 20% Mid-Cap Stocks 15% S&P 500 Historical Average Return 10% Corporate Bonds World Portfolio A 5% Treasury Bills 0% 0% 5% 10% 15% 20% 25% 30% 35% 40% 45% 50% Historical Volatility (standard deviation) Unlike the case for large portfolios, there is no precise relationship between volatility and average return for individual stocks. Individual stocks have higher volatility and lower average returns than the relationship shown for large portfolios. (Annual data from 1926-2014.)
Step by Step Solution
There are 3 Steps involved in it

Get step-by-step solutions from verified subject matter experts