

Question: CAPM predicts that a security's risk premium increase in proportion to its beta of the security, not its volatility. Justify this statement using Figures 10.6
CAPM predicts that a security's risk premium increase in proportion to its beta of the security, not its volatility. Justify this statement using Figures 10.6 and 10.7 in Chapter 10.
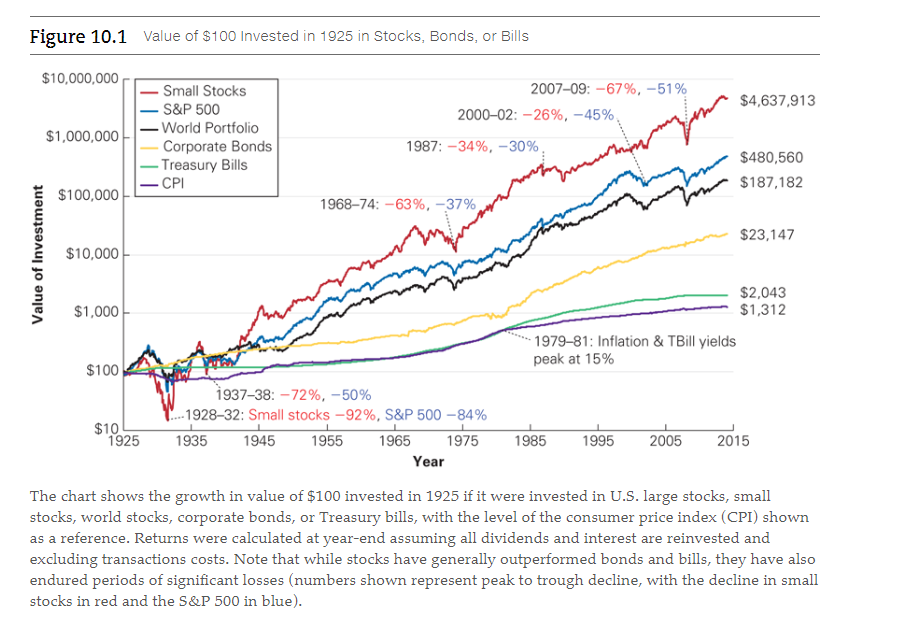
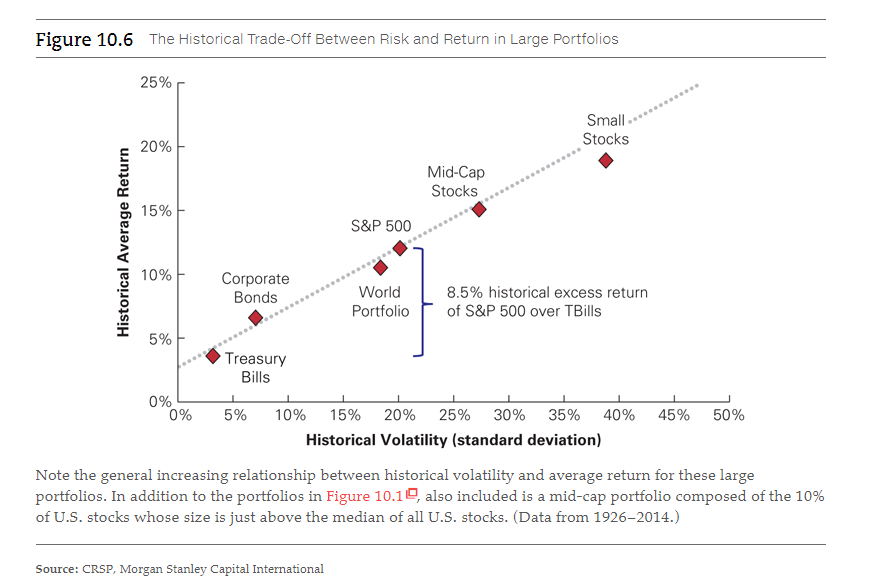
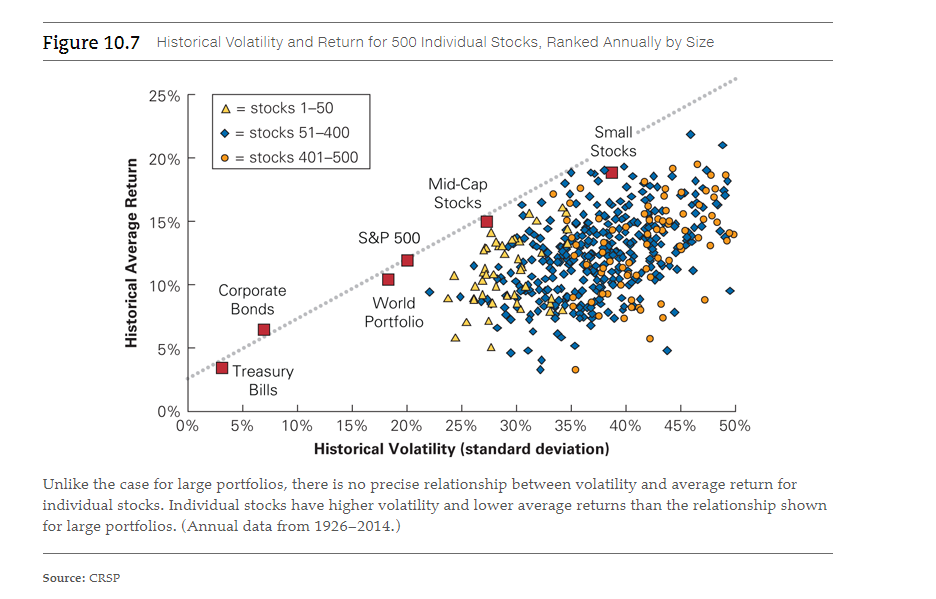
Figure 10.1 Value of $100 Invested in 1925 in Stocks, Bonds, or Bills $10,000,000 200709: -67%, -51% 2000-02: -26%, -45% $4,637,913 $1,000,000 Small Stocks S&P 500 - World Portfolio Corporate Bonds - Treasury Bills CPI mon 1987: -34%, -30% $480,560 $187,182 $100,000 1968-74: -63%, -37% $23,147 Value of Investment $10,000 $1,000 $2,043 $1,312 - 1979-81: Inflation & TBill yields peak at 15% $100 $10 1925 1937-38: -72%, -50% -1928-32: Small stocks -92%, S&P 500 -84% 1935 1945 1955 1965 1975 Year 1985 1995 2005 2015 The chart shows the growth in value of $100 invested in 1925 if it were invested in U.S. large stocks, small stocks, world stocks, corporate bonds, or Treasury bills, with the level of the consumer price index (CPI) shown as a reference. Returns were calculated at year-end assuming all dividends and interest are reinvested and excluding transactions costs. Note that while stocks have generally outperformed bonds and bills, they have also endured periods of significant losses (numbers shown represent peak to trough decline, with the decline in small stocks in red and the S&P 500 in blue). Figure 10.6 The Historical Trade-off Between Risk and Return in Large Portfolios 25% Small Stocks 20% Mid-Cap Stocks 15% S&P 500 Historical Average Return 10% Corporate World Bonds 8.5% historical excess return Portfolio of S&P 500 over TBills 5% Treasury Bills 0% 0% 5% 10% 15% 20% 25% 30% 35% 40% 45% 50% Historical Volatility (standard deviation) Note the general increasing relationship between historical volatility and average return for these large portfolios. In addition to the portfolios in Figure 10.10, also included is a mid-cap portfolio composed of the 10% of U.S. stocks whose size is just above the median of all U.S. stocks. (Data from 1926-2014.) Source: CRSP, Morgan Stanley Capital International Figure 10.7 Historical Volatility and Return for 500 Individual stocks, Ranked Annually by Size 25% A = stocks 1-50 = stocks 51-400 = stocks 401-500 Small Stocks 20% Mid-Cap Stocks 15% S&P 500 Historical Average Return 10% Corporate Bonds World Portfolio 5% Treasury Bills 0% 0% 5% 10% 15% 20% 25% 30% 35% 40% 45% 50% Historical Volatility (standard deviation) Unlike the case for large portfolios, there is no precise relationship between volatility and average return for individual stocks. Individual stocks have higher volatility and lower average returns than the relationship shown for large portfolios. (Annual data from 1926-2014.) Source: CRSP Figure 10.1 Value of $100 Invested in 1925 in Stocks, Bonds, or Bills $10,000,000 200709: -67%, -51% 2000-02: -26%, -45% $4,637,913 $1,000,000 Small Stocks S&P 500 - World Portfolio Corporate Bonds - Treasury Bills CPI mon 1987: -34%, -30% $480,560 $187,182 $100,000 1968-74: -63%, -37% $23,147 Value of Investment $10,000 $1,000 $2,043 $1,312 - 1979-81: Inflation & TBill yields peak at 15% $100 $10 1925 1937-38: -72%, -50% -1928-32: Small stocks -92%, S&P 500 -84% 1935 1945 1955 1965 1975 Year 1985 1995 2005 2015 The chart shows the growth in value of $100 invested in 1925 if it were invested in U.S. large stocks, small stocks, world stocks, corporate bonds, or Treasury bills, with the level of the consumer price index (CPI) shown as a reference. Returns were calculated at year-end assuming all dividends and interest are reinvested and excluding transactions costs. Note that while stocks have generally outperformed bonds and bills, they have also endured periods of significant losses (numbers shown represent peak to trough decline, with the decline in small stocks in red and the S&P 500 in blue). Figure 10.6 The Historical Trade-off Between Risk and Return in Large Portfolios 25% Small Stocks 20% Mid-Cap Stocks 15% S&P 500 Historical Average Return 10% Corporate World Bonds 8.5% historical excess return Portfolio of S&P 500 over TBills 5% Treasury Bills 0% 0% 5% 10% 15% 20% 25% 30% 35% 40% 45% 50% Historical Volatility (standard deviation) Note the general increasing relationship between historical volatility and average return for these large portfolios. In addition to the portfolios in Figure 10.10, also included is a mid-cap portfolio composed of the 10% of U.S. stocks whose size is just above the median of all U.S. stocks. (Data from 1926-2014.) Source: CRSP, Morgan Stanley Capital International Figure 10.7 Historical Volatility and Return for 500 Individual stocks, Ranked Annually by Size 25% A = stocks 1-50 = stocks 51-400 = stocks 401-500 Small Stocks 20% Mid-Cap Stocks 15% S&P 500 Historical Average Return 10% Corporate Bonds World Portfolio 5% Treasury Bills 0% 0% 5% 10% 15% 20% 25% 30% 35% 40% 45% 50% Historical Volatility (standard deviation) Unlike the case for large portfolios, there is no precise relationship between volatility and average return for individual stocks. Individual stocks have higher volatility and lower average returns than the relationship shown for large portfolios. (Annual data from 1926-2014.) Source: CRSP
Step by Step Solution
There are 3 Steps involved in it

Get step-by-step solutions from verified subject matter experts