

Question: CAPSIM Round 3 Based on the above data what can we do to improve our: -research and development -Marketing -Production -Finance Balance Sheet 2021 2020
CAPSIM Round 3
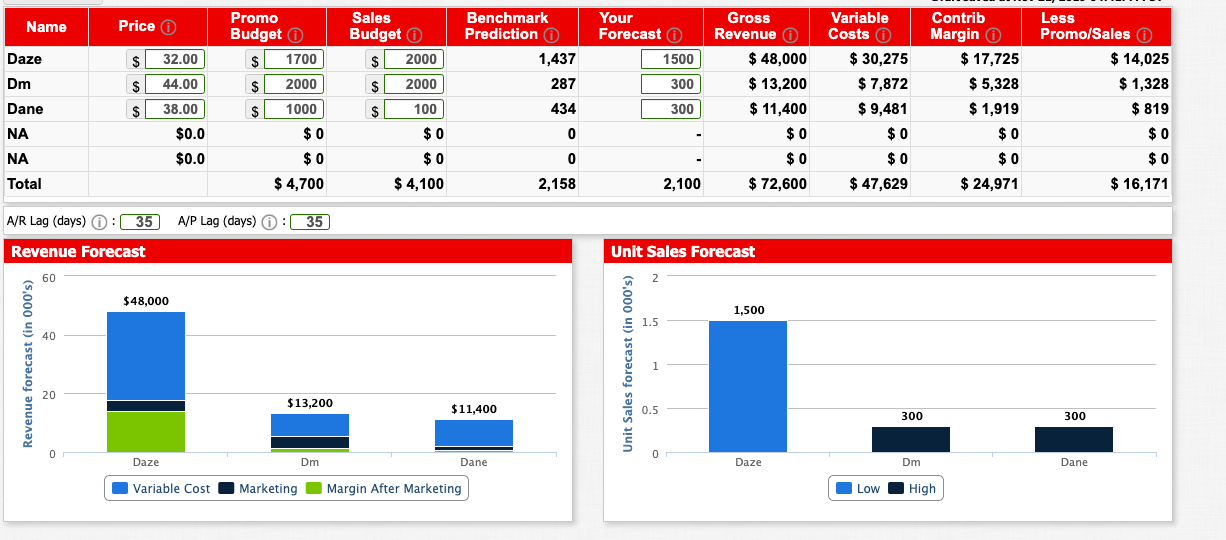
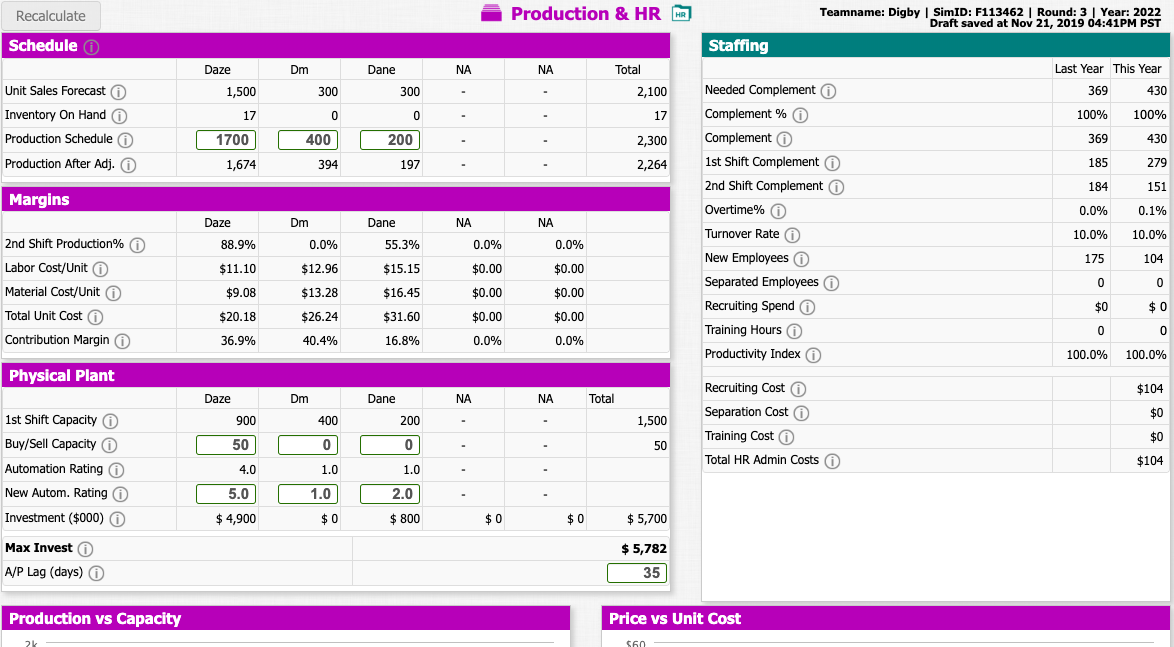
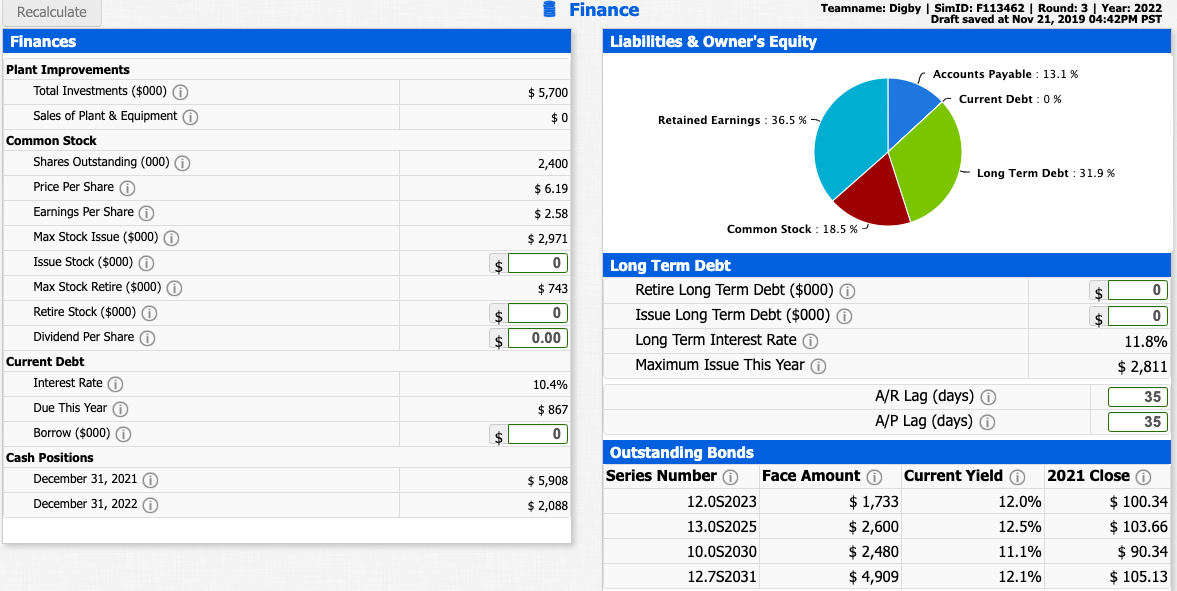
Based on the above data what can we do to improve our:
-research and development
-Marketing
-Production
-Finance
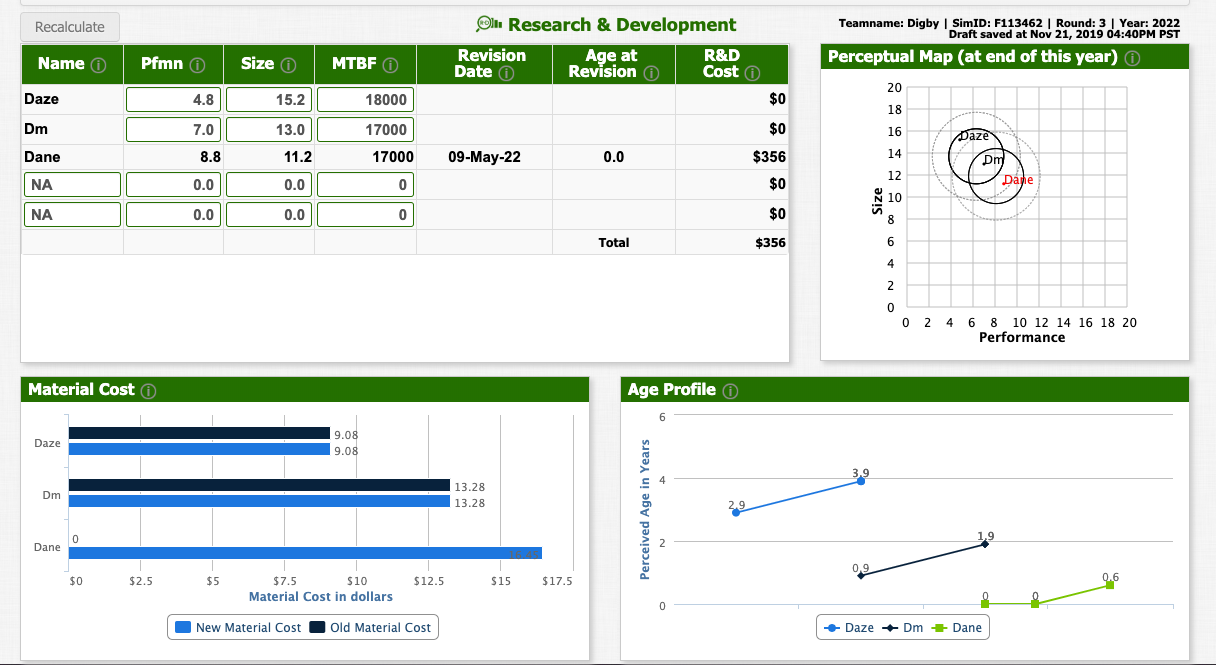
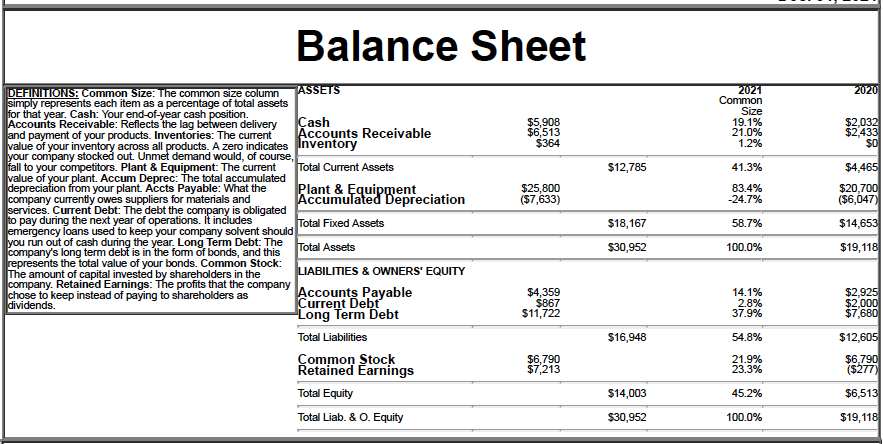
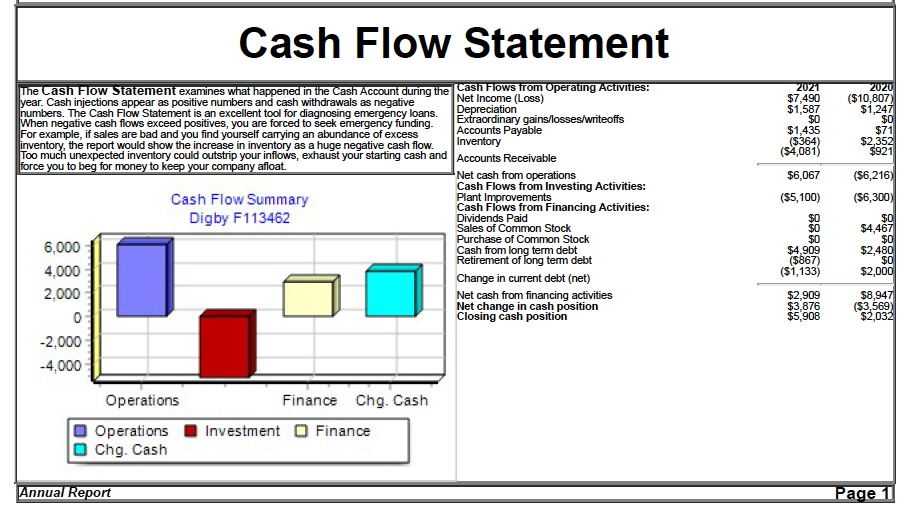
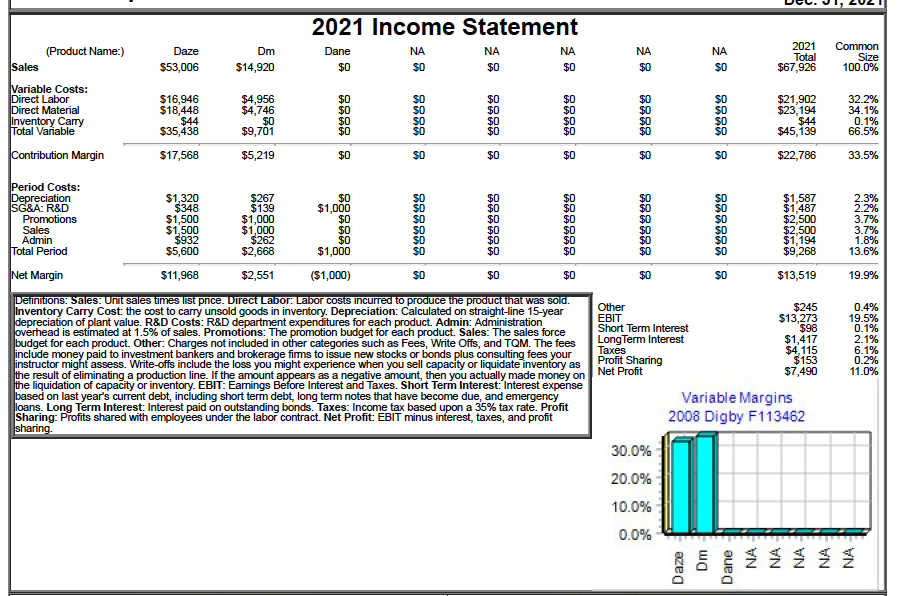
Balance Sheet 2021 2020 Common Size 19.1% 21.0% 1.2% $3,032 $6,513 $364 $2,433 $12,785 41.3% Plant & Equippepreciation DEFINITIONS: Common Size: The common size column simply represents each item as a percentage of total assets for that year. Cash: Your end-of-year cash position. Accounts Receivable: Reflects the lag between delivery Cash and payment of your products. Inventories: The current Accounts Receivable value of your inventory across all products. A zero indicates Inventory your company stocked out. Unmet demand would, of course, fall to your competitors. Plant & Equipment: The current Total Current Assets value of your plant. Accum Deprec: The total accumulated depreciation from your plant. Accts Payable: What the company currently owes suppliers for materials and services. Current Debt: The debt the company is obligated to pay during the next year of operations. It includes Total Fixed Assets emergency loans used to keep your company solvent should you run out of cash during the year. Long Term Debt: The company's long term debt is in the form of bonds, and this Total Assets represents the total value of your bonds. Common Stock: The amount of capital invested by shareholders in the LIABILITIES & OWNERS' EQUITY company. Retained Earnings: The profits that the company chose to keep instead of paying to shareholders as Accounts Payable dividends Current Debt Long Term Debt $4,465 $20,700 ($6,047) $25,800 (57,633) $18,167 58.7% 100.0% $14,653 $19,118 $30,952 $4,359 14.1% $867 $2,925 $2,000 $7,680 2.8% 37.9% $11,722 Total Liabilities $16,948 54.8% $12,605 Common Stock Retained Earnings Total Equity 45.2% $14,003 $30,952 $6,513 $19,118 Total Liab. & O. Equity 100.0% Cash Flow Statement 2021 $7,490 2020 ($10,807 $1,247 $1,587 $0 $1,435 ($364) ($4,081) $0 $71 $2.354 $22921 The Cash Flow Statement examines what happened in the cash Account during the Cash Flows from Operating Activities: year. Cash injections appear as positive numbers and cash withdrawals as negative Net Income (Loss) numbers. The Cash Flow Statement is an excellent tool for diagnosing emergency loans Depreciation When negative cash flows exceed positives, you are forced to seek emergency funding Extraordinary gains/losses/writeoffs For example, if sales are bad and you find yourself carrying an abundance of excess Accounts Payable inventory, the report would show the increase in inventory as a huge negative cash flow. Inventory Too much unexpected inventory could outstrip your inflows, exhaust your starting cash and force you to beg for money to keep your company afloat. Accounts Receivable Net cash from operations Cash Flows from Investing Activities: Cash Flow Summary Plant Improvements Cash Flows from Financing Activities: Digby F113462 Dividends Paid Sales of Common Stock Purchase of Common Stock 6.000 Cash from long term debt Retirement of long term debt 4,000 Change in current debt (net) 2.000 Net cash from financing activities Net change in cash position Closing cash position $6,067 (55,100) (56,216) (56,300 84,469 $4,909 ($867) ($1,133) $2,480 $2,000 $8,947 (53,569) $2,032 $2,909 $3,876 $5,908 OA -2,000 -4,000 Operations Finance Chg. Cash Operations Chg. Cash Investment Finance Annual Report Page 1 UCU. JI, 2021 2021 Income Statement (Product Name:) Dane Daze $53,006 Dm $14,920 2021 Total $67,926 Common Size 100.0% Sales Variable Costs: Direct Labor Direct Material Inventory Carry Total Variable $16,946 $18,448 $44 $35,438 $4,956 $4,746 32.2% 34.1% 0.1% $0 $9,701 $21,902 $23,194 $44 $45,139 $22,786 66.5% Contribution Margin $17,568 $5,219 33.5% $1,320 2.3% $1,000 Period Costs: Depreciation SG&A: R&D Promotions Sales Admin Total Period 2.2% $1,587 $2,500 $348 $1,500 $932 $5,600 $1.500 $267 $139 $1,000 $1,000 $262 $2,668 $1,487 $2,500 $1,194 $9,268 $13,519 3.7% 3.7% 1.8% 13.6% $1,000 Net Margin $11,968 $2,551 ($1,000) 19.9% Definitions: Sales: Unit sales times list pnce. Direct Labor: Labor costs incurred to produce the product inat was sold. Inventory Carry Cost: the cost to carry unsold goods in inventory. Depreciation: Calculated on straight-line 15-year depreciation of plant value. R&D Costs: R&D department expenditures for each product. Admin: Administration overhead is estimated at 1.5% of sales. Promotions: The promotion budget for each product. Sales: The sales force budget for each product. Other: Charges not included in other categories such as Fees, Write Offs, and TQM. The fees include money paid to investment bankers and brokerage firms to issue new stocks or bonds plus consulting fees your instructor might assess. Write-offs include the loss you might experience when you sell capacity or liquidate inventory as the result of eliminating a production line. If the amount appears as a negative amount, then you actually made money on the liquidation of capacity or inventory. EBIT: Earnings Before Interest and Taxes. Short Term Interest: Interest expense based on last year's current debt, including short term debt, long term notes that have become due, and emergency loans. Long Term Interest: Interest paid on outstanding bonds. Taxes: Income tax based upon a 35% tax rate. Profit Sharing: Profits shared with employees under the labor contract. Net Profit: EBIT minus interest, taxes, and profit sharing. $4, 115 Other $245 EBIT $13,273 Short Term Interest $98 Long Term Interest $1,417 Taxes Profit Sharing $153 Net Profit $7,490 Variable Margins 2008 Digby F113462 0.4% 19.5% 0.1% 2.1% 6.1% 0.2% 11.0% 30.0% 20.0% 10.0% 0.0% Daze Dm Dane NA Profit History F113462 Market Share History F113462 $5,000 50 10% 10 -S5,000 -$10,000 2019 2020 2021 2019 2020 2021 ROE History F113462 Asset Turnover History F113462 50% 0% -50% 1 -100% 1 -150% 2019 2020 2021 2019 2020 2021 ROS History F113462 ROA History F113462 0% -20% 20.0% 0.0% -20.0% -40.0% -60.0% -40% 2019 Annual Report 2020 2021 2019 2020 2021 Page 2 Recalculate Olin Research & Development Revision Age at R&D Date 0 Revision Cost Teamname: Digby SimID: F113462 | Round: 3 | Year: 2022 Draft saved at Nov 21, 2019 04:40PM PST Perceptual Map (at end of this year) Name . Daze 4.8 $0 Pfmn Size MTBF 15.2 18000 13.0 17000 11.2 17000 L 0.00 0.00 0 ] 0.0 | 0.00 0 09-May-22 0.0 Dm Dane NA | NA $356 $0 Dape Size $0 Total $356 0 2 4 6 8 10 12 14 16 18 20 Performance Material Cost Age Profile Daze 9.08 9.08 13.28 13.28 Perceived Age in Years Dane $0 $2.5 $5 $7.5 $ 10 Material Cost in dollars $12.5 $15 $17.5 New Material Cost Old Material Cost + Daze + Dm + Dane Name Price Benchmark Prediction 1,437 Daze Dm Dane $ $ $ 32.00 44.00 38.00 Promo Budget 1700 $ 2000 $ 1000 $ 0 $ 0 $ 4,700 Sales Budget $ 2000 $ 2000 $ 100 $ 0 Your Forecast 1500 300 300 287 Gross Revenue 0 $ 48,000 $ 13,200 $ 11,400 $0 $ 0 $ 72,600 434 Variable Costs $ 30,275 $ 7,872 $ 9,481 $ 0 $0 $ 47,629 Contrib Margin $ 17,725 $ 5,328 $ 1,919 $ 0 Less Promo/Sales $ 14,025 $ 1,328 $ 819 $ 0 $0 $ 16,171 NA $0.0 0 $0.0 $ 0 $0 NA Total $4,100 2,158 2,100 $ 24,971 A/P Lag (days) 0: 35 A/R Lag (days) 0: 35 Revenue Forecast Unit Sales Forecast $48,000 1,500 Revenue forecast (in 000's) Unit Sales forecast (in 000's) $13,200 $11,400 300 300 Daze Dm Dane Daze Dane Dm High Variable Cost Marketing Margin After Marketing Low Production & HR HR Teamname: Digby | SimID: F113462 | Round: 3 Year: 2022 Draft saved at Nov 21, 2019 04:41PM PST Recalculate Schedule Staffing Total 2,100 Unit Sales Forecast Inventory On Hand Production Schedule Production After Adj. O Daze Dm Dane NA 1,500 300 300 17 00 1700 400 200 1,674 394 197 2,300 2,264 Last Year This Year 369 430 100% 100% 369 430 185 279 184 151 0.0% 0.1% 10.0% 10.0% 175 104 0 $0 Margins Dm NA N Daze 88.9% $11.10 Needed Complement Complement % Complement 1st Shift Complement 2nd Shift Complement Overtime% Turnover Rate New Employees Separated Employees Recruiting Spend Training Hours Productivity Index 0.0% 0.0% $0.00 $12.96 Dane 55.3% $15.15 $16.45 $31.60 16.8% 2nd Shift Production% Labor Cost/Unit Material Cost/Unit Total Unit Cost Contribution Margin A 0.0% $0.00 $0.00 $0.00 0.0% $13.28 $0.00 $9.08 $20.18 36.9% $26.24 $0.00 0.0% 0 40.4% 100.0% 100.0% Physical Plant $104 NA NA Total $0 1,500 50 Recruiting Cost Separation Cost Training Cost Total HR Admin Costs Daze Dm Dane 900 400 200 50 C0 C0 4.0 1.0 1.0 5.0 1.0 2.0 $ 4,900 $0 $ 800 1st Shift Capacity Buy/Sell Capacity Automation Rating New Autom. Rating Investment ($000) Max Invest A/P Lag (days) $0 $104 $0 $0 $5,700 $ 5,782 35 Production vs Capacity Price vs Unit Cost 560 Recalculate Finance Teamname: Digby | SimID: F113462 Round: 3 | Year: 2022 Draft saved at Nov 21, 2019 04:42PM PST Liabilities & Owner's Equity Finances $ 5,700 $ 0 Accounts Payable : 13.1% Current Debt: 0% Retained Earnings : 36.5% - Long Term Debt: 31.9 % Plant Improvements Total Investments ($000) Sales of Plant & Equipment Common Stock Shares Outstanding (000) Price Per Share o Earnings Per Share o Max Stock Issue ($000) Issue Stock ($000) Max Stock Retire ($000) Retire Stock ($000) Dividend Per Share o Current Debt Interest Rate Due This Year Borrow ($000) Cash Positions December 31, 2021 O December 31, 2022 2,400 $6.19 $ 2.58 $ 2,971 0 $ 743 Common Stock : 18.5% Long Term Debt Retire Long Term Debt ($000) O Issue Long Term Debt ($000) Long Term Interest Rate O Maximum Issue This Year $ 0.00 0 $ 1 0 11.8% $ 2,811 10.4% $ 867 0 A/R Lag (days) A/P Lag (days) 35 35 $ $5,908 $ 2,088 Outstanding Bonds Series Number Face Amount Current Yield 12.0S2023 $ 1,733 12.0% 13.0S2025 $ 2,600 12.5% 10.0S2030 $ 2,480 11.1% 12.752031 $ 4,909 12.1% 2021 Close $ 100.34 $ 103.66 $ 90.34 $ 105.13 Balance Sheet 2021 2020 Common Size 19.1% 21.0% 1.2% $3,032 $6,513 $364 $2,433 $12,785 41.3% Plant & Equippepreciation DEFINITIONS: Common Size: The common size column simply represents each item as a percentage of total assets for that year. Cash: Your end-of-year cash position. Accounts Receivable: Reflects the lag between delivery Cash and payment of your products. Inventories: The current Accounts Receivable value of your inventory across all products. A zero indicates Inventory your company stocked out. Unmet demand would, of course, fall to your competitors. Plant & Equipment: The current Total Current Assets value of your plant. Accum Deprec: The total accumulated depreciation from your plant. Accts Payable: What the company currently owes suppliers for materials and services. Current Debt: The debt the company is obligated to pay during the next year of operations. It includes Total Fixed Assets emergency loans used to keep your company solvent should you run out of cash during the year. Long Term Debt: The company's long term debt is in the form of bonds, and this Total Assets represents the total value of your bonds. Common Stock: The amount of capital invested by shareholders in the LIABILITIES & OWNERS' EQUITY company. Retained Earnings: The profits that the company chose to keep instead of paying to shareholders as Accounts Payable dividends Current Debt Long Term Debt $4,465 $20,700 ($6,047) $25,800 (57,633) $18,167 58.7% 100.0% $14,653 $19,118 $30,952 $4,359 14.1% $867 $2,925 $2,000 $7,680 2.8% 37.9% $11,722 Total Liabilities $16,948 54.8% $12,605 Common Stock Retained Earnings Total Equity 45.2% $14,003 $30,952 $6,513 $19,118 Total Liab. & O. Equity 100.0% Cash Flow Statement 2021 $7,490 2020 ($10,807 $1,247 $1,587 $0 $1,435 ($364) ($4,081) $0 $71 $2.354 $22921 The Cash Flow Statement examines what happened in the cash Account during the Cash Flows from Operating Activities: year. Cash injections appear as positive numbers and cash withdrawals as negative Net Income (Loss) numbers. The Cash Flow Statement is an excellent tool for diagnosing emergency loans Depreciation When negative cash flows exceed positives, you are forced to seek emergency funding Extraordinary gains/losses/writeoffs For example, if sales are bad and you find yourself carrying an abundance of excess Accounts Payable inventory, the report would show the increase in inventory as a huge negative cash flow. Inventory Too much unexpected inventory could outstrip your inflows, exhaust your starting cash and force you to beg for money to keep your company afloat. Accounts Receivable Net cash from operations Cash Flows from Investing Activities: Cash Flow Summary Plant Improvements Cash Flows from Financing Activities: Digby F113462 Dividends Paid Sales of Common Stock Purchase of Common Stock 6.000 Cash from long term debt Retirement of long term debt 4,000 Change in current debt (net) 2.000 Net cash from financing activities Net change in cash position Closing cash position $6,067 (55,100) (56,216) (56,300 84,469 $4,909 ($867) ($1,133) $2,480 $2,000 $8,947 (53,569) $2,032 $2,909 $3,876 $5,908 OA -2,000 -4,000 Operations Finance Chg. Cash Operations Chg. Cash Investment Finance Annual Report Page 1 UCU. JI, 2021 2021 Income Statement (Product Name:) Dane Daze $53,006 Dm $14,920 2021 Total $67,926 Common Size 100.0% Sales Variable Costs: Direct Labor Direct Material Inventory Carry Total Variable $16,946 $18,448 $44 $35,438 $4,956 $4,746 32.2% 34.1% 0.1% $0 $9,701 $21,902 $23,194 $44 $45,139 $22,786 66.5% Contribution Margin $17,568 $5,219 33.5% $1,320 2.3% $1,000 Period Costs: Depreciation SG&A: R&D Promotions Sales Admin Total Period 2.2% $1,587 $2,500 $348 $1,500 $932 $5,600 $1.500 $267 $139 $1,000 $1,000 $262 $2,668 $1,487 $2,500 $1,194 $9,268 $13,519 3.7% 3.7% 1.8% 13.6% $1,000 Net Margin $11,968 $2,551 ($1,000) 19.9% Definitions: Sales: Unit sales times list pnce. Direct Labor: Labor costs incurred to produce the product inat was sold. Inventory Carry Cost: the cost to carry unsold goods in inventory. Depreciation: Calculated on straight-line 15-year depreciation of plant value. R&D Costs: R&D department expenditures for each product. Admin: Administration overhead is estimated at 1.5% of sales. Promotions: The promotion budget for each product. Sales: The sales force budget for each product. Other: Charges not included in other categories such as Fees, Write Offs, and TQM. The fees include money paid to investment bankers and brokerage firms to issue new stocks or bonds plus consulting fees your instructor might assess. Write-offs include the loss you might experience when you sell capacity or liquidate inventory as the result of eliminating a production line. If the amount appears as a negative amount, then you actually made money on the liquidation of capacity or inventory. EBIT: Earnings Before Interest and Taxes. Short Term Interest: Interest expense based on last year's current debt, including short term debt, long term notes that have become due, and emergency loans. Long Term Interest: Interest paid on outstanding bonds. Taxes: Income tax based upon a 35% tax rate. Profit Sharing: Profits shared with employees under the labor contract. Net Profit: EBIT minus interest, taxes, and profit sharing. $4, 115 Other $245 EBIT $13,273 Short Term Interest $98 Long Term Interest $1,417 Taxes Profit Sharing $153 Net Profit $7,490 Variable Margins 2008 Digby F113462 0.4% 19.5% 0.1% 2.1% 6.1% 0.2% 11.0% 30.0% 20.0% 10.0% 0.0% Daze Dm Dane NA Profit History F113462 Market Share History F113462 $5,000 50 10% 10 -S5,000 -$10,000 2019 2020 2021 2019 2020 2021 ROE History F113462 Asset Turnover History F113462 50% 0% -50% 1 -100% 1 -150% 2019 2020 2021 2019 2020 2021 ROS History F113462 ROA History F113462 0% -20% 20.0% 0.0% -20.0% -40.0% -60.0% -40% 2019 Annual Report 2020 2021 2019 2020 2021 Page 2 Recalculate Olin Research & Development Revision Age at R&D Date 0 Revision Cost Teamname: Digby SimID: F113462 | Round: 3 | Year: 2022 Draft saved at Nov 21, 2019 04:40PM PST Perceptual Map (at end of this year) Name . Daze 4.8 $0 Pfmn Size MTBF 15.2 18000 13.0 17000 11.2 17000 L 0.00 0.00 0 ] 0.0 | 0.00 0 09-May-22 0.0 Dm Dane NA | NA $356 $0 Dape Size $0 Total $356 0 2 4 6 8 10 12 14 16 18 20 Performance Material Cost Age Profile Daze 9.08 9.08 13.28 13.28 Perceived Age in Years Dane $0 $2.5 $5 $7.5 $ 10 Material Cost in dollars $12.5 $15 $17.5 New Material Cost Old Material Cost + Daze + Dm + Dane Name Price Benchmark Prediction 1,437 Daze Dm Dane $ $ $ 32.00 44.00 38.00 Promo Budget 1700 $ 2000 $ 1000 $ 0 $ 0 $ 4,700 Sales Budget $ 2000 $ 2000 $ 100 $ 0 Your Forecast 1500 300 300 287 Gross Revenue 0 $ 48,000 $ 13,200 $ 11,400 $0 $ 0 $ 72,600 434 Variable Costs $ 30,275 $ 7,872 $ 9,481 $ 0 $0 $ 47,629 Contrib Margin $ 17,725 $ 5,328 $ 1,919 $ 0 Less Promo/Sales $ 14,025 $ 1,328 $ 819 $ 0 $0 $ 16,171 NA $0.0 0 $0.0 $ 0 $0 NA Total $4,100 2,158 2,100 $ 24,971 A/P Lag (days) 0: 35 A/R Lag (days) 0: 35 Revenue Forecast Unit Sales Forecast $48,000 1,500 Revenue forecast (in 000's) Unit Sales forecast (in 000's) $13,200 $11,400 300 300 Daze Dm Dane Daze Dane Dm High Variable Cost Marketing Margin After Marketing Low Production & HR HR Teamname: Digby | SimID: F113462 | Round: 3 Year: 2022 Draft saved at Nov 21, 2019 04:41PM PST Recalculate Schedule Staffing Total 2,100 Unit Sales Forecast Inventory On Hand Production Schedule Production After Adj. O Daze Dm Dane NA 1,500 300 300 17 00 1700 400 200 1,674 394 197 2,300 2,264 Last Year This Year 369 430 100% 100% 369 430 185 279 184 151 0.0% 0.1% 10.0% 10.0% 175 104 0 $0 Margins Dm NA N Daze 88.9% $11.10 Needed Complement Complement % Complement 1st Shift Complement 2nd Shift Complement Overtime% Turnover Rate New Employees Separated Employees Recruiting Spend Training Hours Productivity Index 0.0% 0.0% $0.00 $12.96 Dane 55.3% $15.15 $16.45 $31.60 16.8% 2nd Shift Production% Labor Cost/Unit Material Cost/Unit Total Unit Cost Contribution Margin A 0.0% $0.00 $0.00 $0.00 0.0% $13.28 $0.00 $9.08 $20.18 36.9% $26.24 $0.00 0.0% 0 40.4% 100.0% 100.0% Physical Plant $104 NA NA Total $0 1,500 50 Recruiting Cost Separation Cost Training Cost Total HR Admin Costs Daze Dm Dane 900 400 200 50 C0 C0 4.0 1.0 1.0 5.0 1.0 2.0 $ 4,900 $0 $ 800 1st Shift Capacity Buy/Sell Capacity Automation Rating New Autom. Rating Investment ($000) Max Invest A/P Lag (days) $0 $104 $0 $0 $5,700 $ 5,782 35 Production vs Capacity Price vs Unit Cost 560 Recalculate Finance Teamname: Digby | SimID: F113462 Round: 3 | Year: 2022 Draft saved at Nov 21, 2019 04:42PM PST Liabilities & Owner's Equity Finances $ 5,700 $ 0 Accounts Payable : 13.1% Current Debt: 0% Retained Earnings : 36.5% - Long Term Debt: 31.9 % Plant Improvements Total Investments ($000) Sales of Plant & Equipment Common Stock Shares Outstanding (000) Price Per Share o Earnings Per Share o Max Stock Issue ($000) Issue Stock ($000) Max Stock Retire ($000) Retire Stock ($000) Dividend Per Share o Current Debt Interest Rate Due This Year Borrow ($000) Cash Positions December 31, 2021 O December 31, 2022 2,400 $6.19 $ 2.58 $ 2,971 0 $ 743 Common Stock : 18.5% Long Term Debt Retire Long Term Debt ($000) O Issue Long Term Debt ($000) Long Term Interest Rate O Maximum Issue This Year $ 0.00 0 $ 1 0 11.8% $ 2,811 10.4% $ 867 0 A/R Lag (days) A/P Lag (days) 35 35 $ $5,908 $ 2,088 Outstanding Bonds Series Number Face Amount Current Yield 12.0S2023 $ 1,733 12.0% 13.0S2025 $ 2,600 12.5% 10.0S2030 $ 2,480 11.1% 12.752031 $ 4,909 12.1% 2021 Close $ 100.34 $ 103.66 $ 90.34 $ 105.13
Step by Step Solution
There are 3 Steps involved in it

Get step-by-step solutions from verified subject matter experts