

Question: Carbon Footprint (g CO2) Std. Variable n Mean Dev. Min. Q1 Median Q3 Max. Energy 24 374 67 279 321 368 414 546 Content
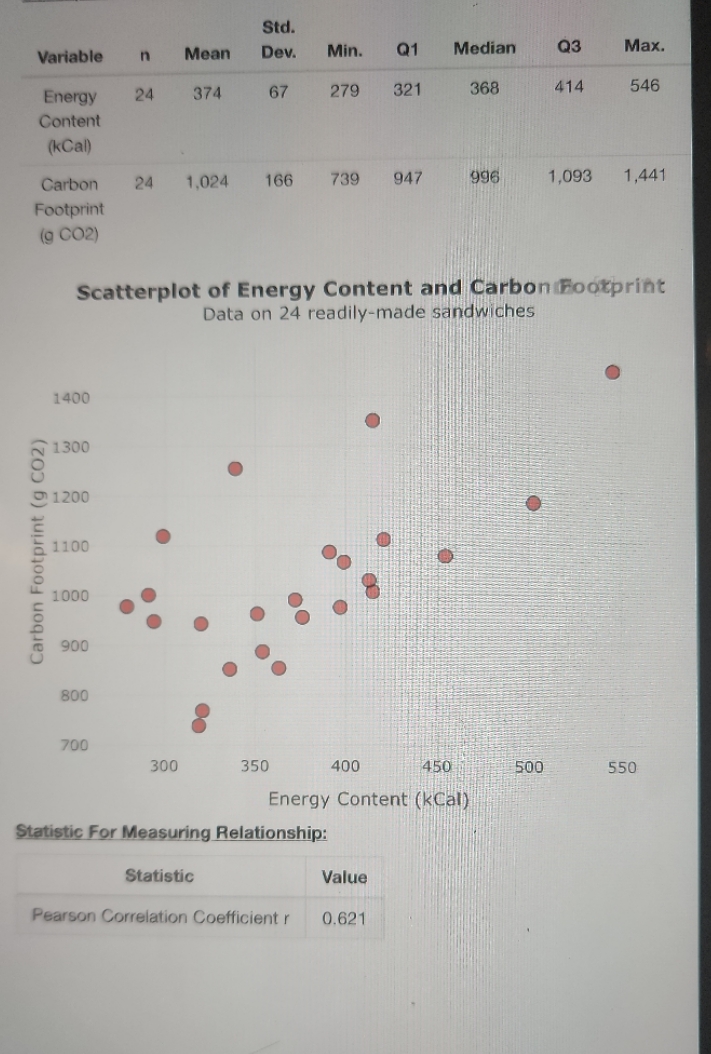
Carbon Footprint (g CO2) Std. Variable n Mean Dev. Min. Q1 Median Q3 Max. Energy 24 374 67 279 321 368 414 546 Content (kCal) Carbon Footprint 24 1,024 166 739 947 996 1,093 1,441 (g CO2) Scatterplot of Energy Content and Carbon Footprint Data on 24 readily-made sandwiches 1400 1300 1200 1100 1000 900 800 700 300 350 400 450 500 550 Energy Content (kcal) Statistic For Measuring Relationship: Statistic Value Pearson Correlation Coefficient r 0.621
Step by Step Solution
There are 3 Steps involved in it
1 Expert Approved Answer
Step: 1 Unlock

Question Has Been Solved by an Expert!
Get step-by-step solutions from verified subject matter experts
Step: 2 Unlock
Step: 3 Unlock