

Question: solve these practice problems The relative conductivity of a semiconductor device is determined by the amount of impurity doped into the device during its manufacture.
solve these practice problems
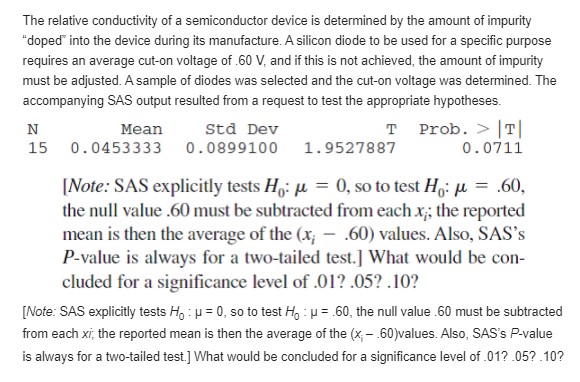
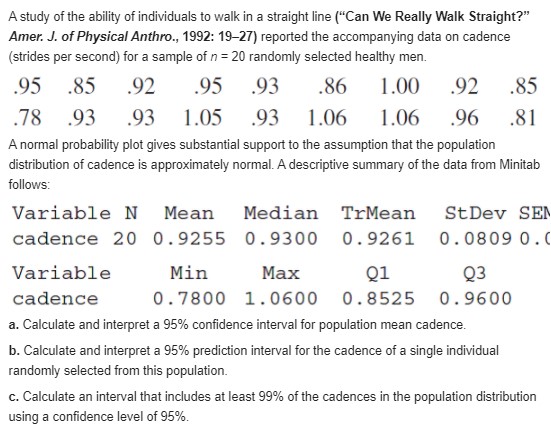
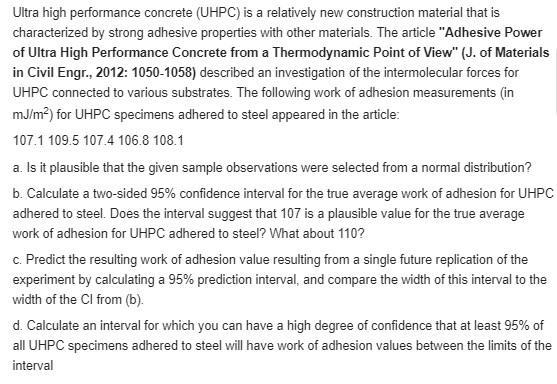
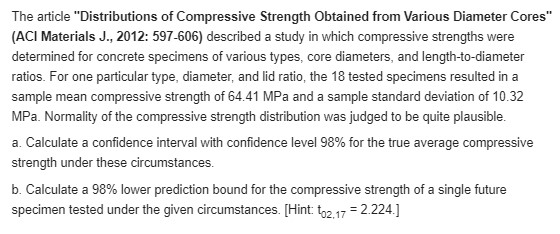
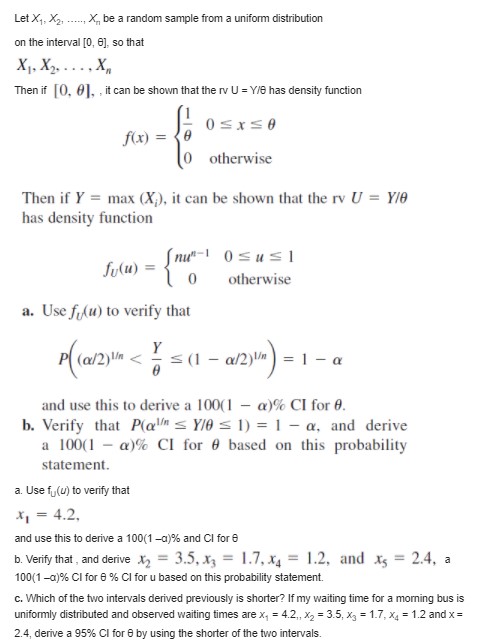
The relative conductivity of a semiconductor device is determined by the amount of impurity "doped" into the device during its manufacture. A silicon diode to be used for a specific purpose requires an average cut-on voltage of .60 V, and if this is not achieved, the amount of impurity must be adjusted. A sample of diodes was selected and the cut-on voltage was determined. The accompanying SAS output resulted from a request to test the appropriate hypotheses. N Mean Std Dev T Prob. > T 15 0.0453333 0.0899100 1.9527887 0 . 0711 [Note: SAS explicitly tests Ho: u = 0, so to test H: u = .60, the null value .60 must be subtracted from each x ; the reported mean is then the average of the (x; - .60) values. Also, SAS's P-value is always for a two-tailed test.] What would be con- cluded for a significance level of .01? .05? .10? [Note: SAS explicitly tests Ho : p = 0, so to test Ho : p = .60, the null value .60 must be subtracted from each xi; the reported mean is then the average of the (x - .60)values. Also, SAS's P-value is always for a two-tailed test.] What would be concluded for a significance level of .01? .05? .10?A study of the ability of individuals to walk in a straight line ("Can We Really Walk Straight?" Amer. J. of Physical Anthro., 1992: 19-27) reported the accompanying data on cadence (strides per second) for a sample of n = 20 randomly selected healthy men. 95 .85 92 95 .93 .86 1.00 92 .85 78 93 93 1.05 93 1.06 1.06 96 .81 A normal probability plot gives substantial support to the assumption that the population distribution of cadence is approximately normal. A descriptive summary of the data from Minitab follows: Variable N Mean Median TrMean StDev SEM cadence 20 0. 9255 0. 9300 0. 9261 0. 0809 0. Variable Min Max Q1 Q3 cadence 0 . 7800 1. 0600 0. 8525 0. 9600 a. Calculate and interpret a 95% confidence interval for population mean cadence. b. Calculate and interpret a 95% prediction interval for the cadence of a single individual randomly selected from this population. c. Calculate an interval that includes at least 99% of the cadences in the population distribution using a confidence level of 95%.Ultra high performance concrete (UHPC) is a relatively new construction material that is characterized by strong adhesive properties with other materials. The article "Adhesive Power of Ultra High Performance Concrete from a Thermodynamic Point of View" (J. of Materials in Civil Engr., 2012: 1050-1058) described an investigation of the intermolecular forces for UHPC connected to various substrates. The following work of adhesion measurements (in mJ/m2) for UHPC specimens adhered to steel appeared in the article: 107.1 109.5 107.4 106.8 108.1 a. Is it plausible that the given sample observations were selected from a normal distribution? b. Calculate a two-sided 95% confidence interval for the true average work of adhesion for UHPC adhered to steel. Does the interval suggest that 107 is a plausible value for the true average work of adhesion for UHPC adhered to steel? What about 110? c. Predict the resulting work of adhesion value resulting from a single future replication of the experiment by calculating a 95% prediction interval, and compare the width of this interval to the width of the Cl from (b). d. Calculate an interval for which you can have a high degree of confidence that at least 95% of all UHPC specimens adhered to steel will have work of adhesion values between the limits of the intervalThe article "Distributions of Compressive Strength Obtained from Various Diameter Cores" (ACI Materials J., 2012: 597-606) described a study in which compressive strengths were determined for concrete specimens of various types, core diameters, and length-to-diameter ratios. For one particular type, diameter, and lid ratio, the 18 tested specimens resulted in a sample mean compressive strength of 64.41 MPa and a sample standard deviation of 10.32 MPa. Normality of the compressive strength distribution was judged to be quite plausible. a. Calculate a confidence interval with confidence level 98% for the true average compressive strength under these circumstances. b. Calculate a 98% lower prediction bound for the compressive strength of a single future specimen tested under the given circumstances. [Hint: to2 17 = 2.224.]For those of you who don't already know, dragon boat racing is a competitive water sport that involves 20 paddlers propelling a boat across various race distances. It has become increasingly popular over the last few years. The article "Physiological and Physical Characteristics of Elite Dragon Boat Paddlers" (J. of Strength and Conditioning, 2013: 137-145) summarized an extensive statistical analysis of data obtained from a sample of 11 paddlers. It reported that a 95% confidence interval for true average force (N) during a simulated 200-m race was (60.2, 70.6). Obtain a 95% prediction interval for the force of a single randomly selected dragon boat paddler undergoing the simulated race.Let X1, X2, ..., X, be a random sample from a uniform distribution on the interval [0, 0], so that X1, X2. . . . . X, Then if [O, 0], , it can be shown that the rv U = Y/0 has density function f(x) = O otherwise Then if Y = max (X,), it can be shown that the rv U = Y/0 has density function Sulu) = n"! OSuEl lo otherwise a. Use flu) to verify that P( (@/2) In
Step by Step Solution
There are 3 Steps involved in it

Get step-by-step solutions from verified subject matter experts