

Question: Carry your intermediate computations to at least three decimal places and round your answers as specified in the table. (If necessary, consult a list
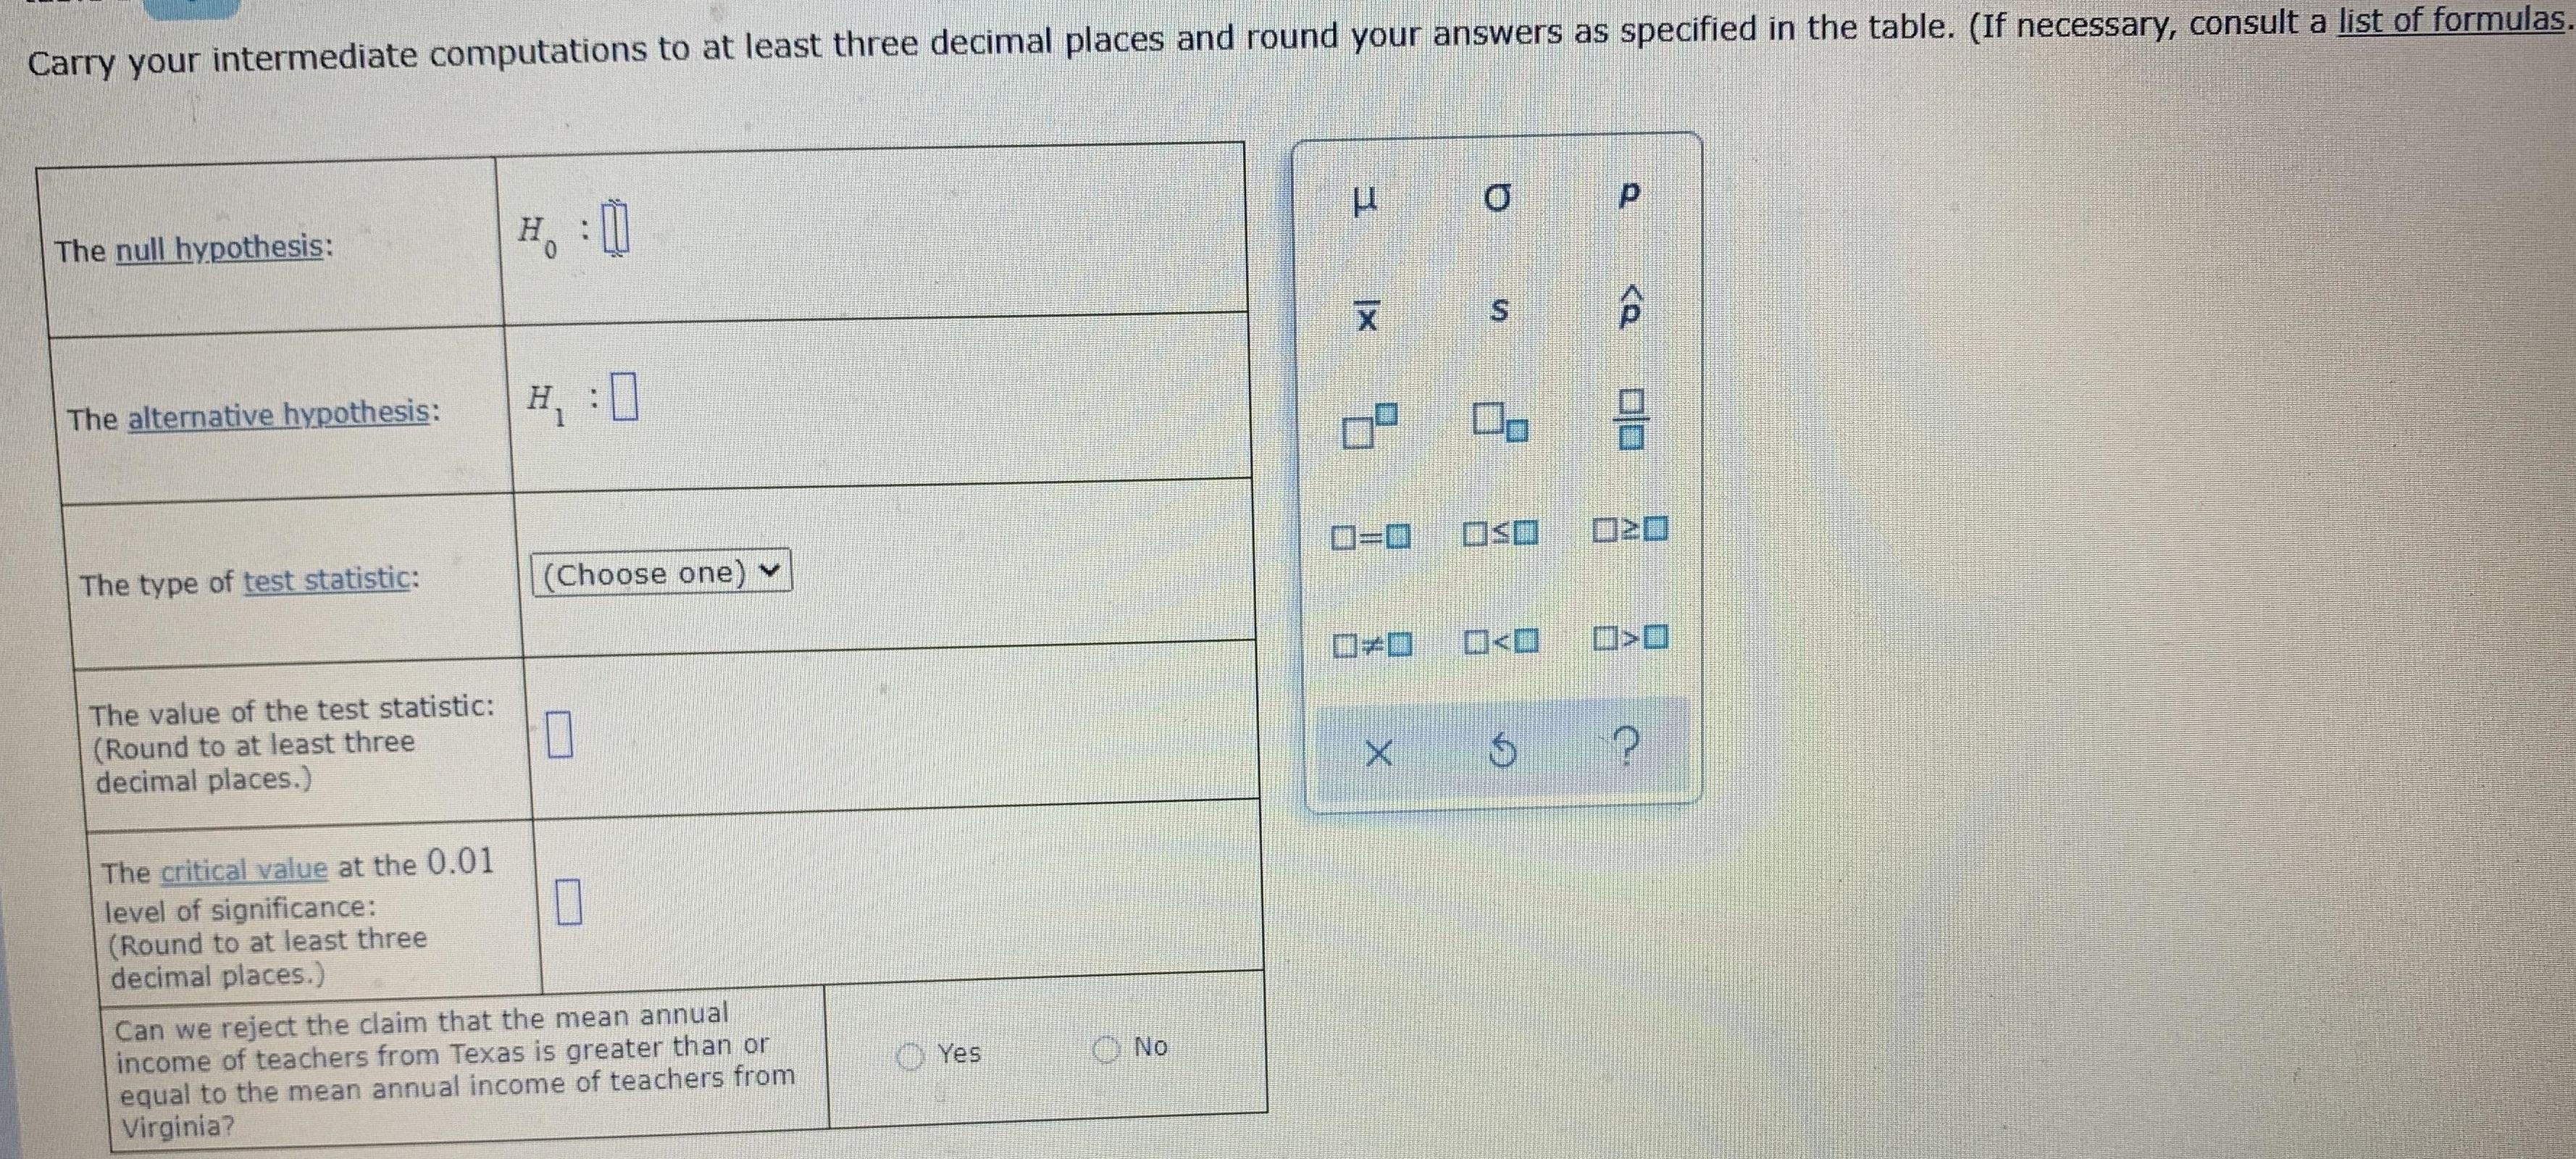
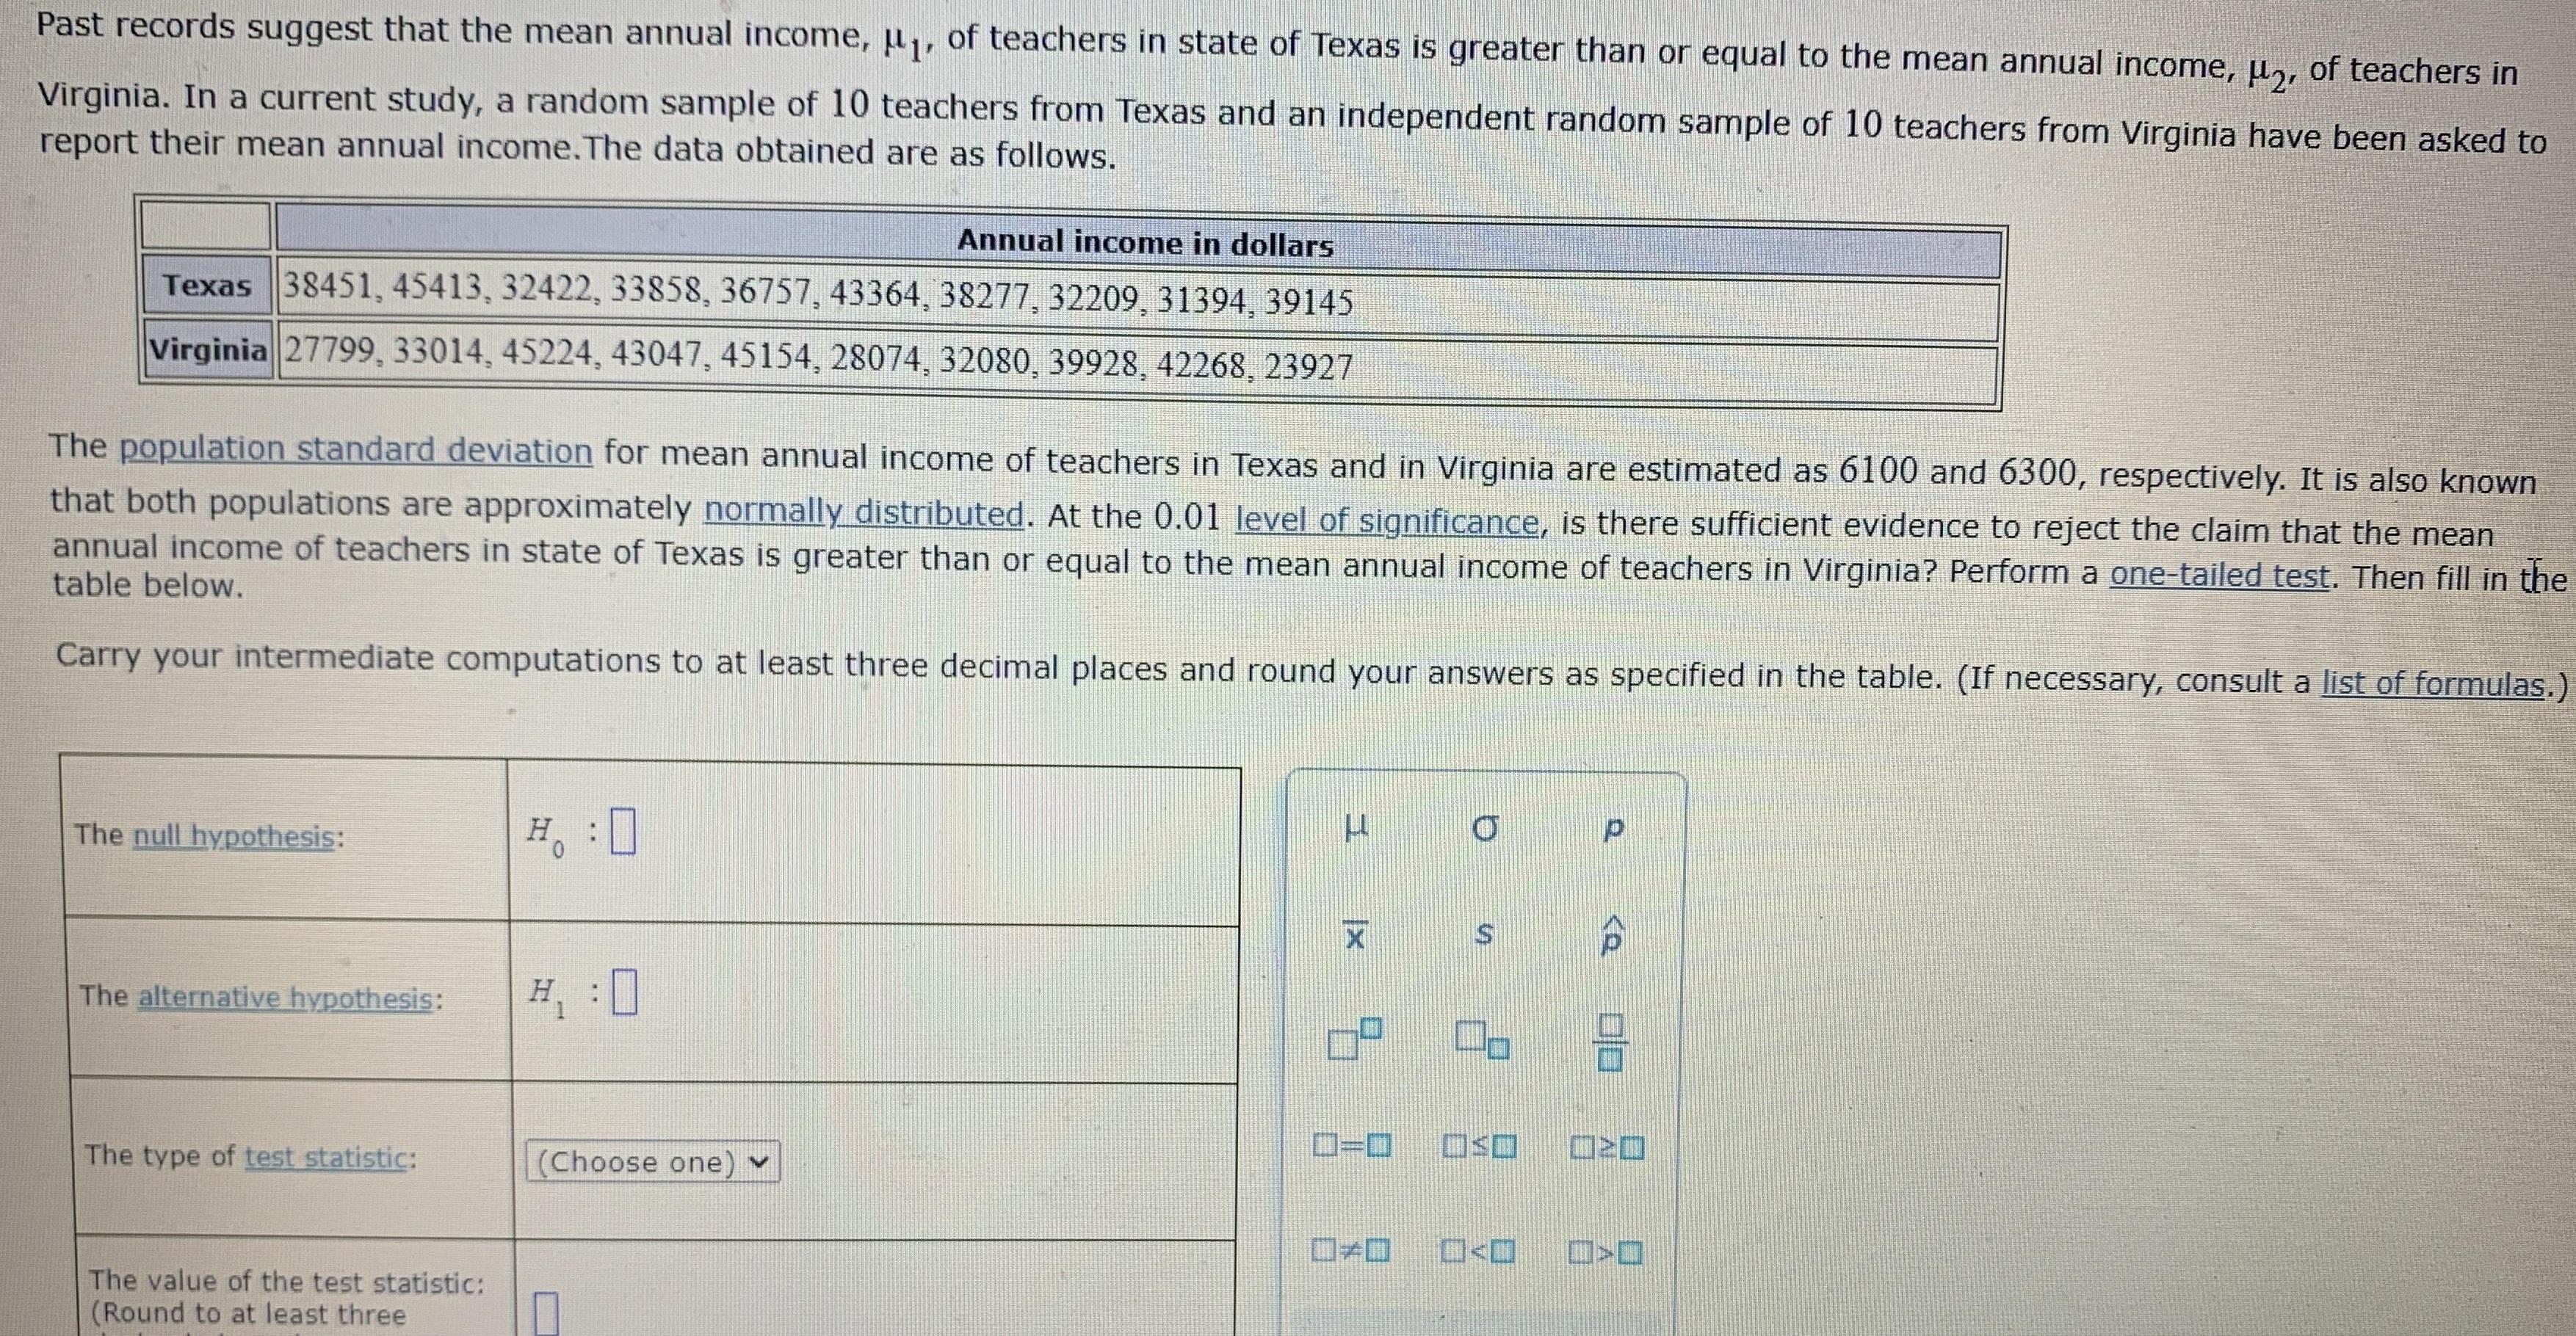
Carry your intermediate computations to at least three decimal places and round your answers as specified in the table. (If necessary, consult a list of formulas. The null hypothesis: The alternative hypothesis: H, :0 The type of test statistic: |(Choose one) v O=0 OSO The value of the test statistic: (Round to at least three decimal places.) The critical value at the 0.01 level of significance: (Round to at least three decimal places.) Can we reject the claim that the mean annual income of teachers from Texas is greater than or equal to the mean annual income of teachers from Virginia? O Yes O No of teachers in state of Texas is greater than or equal to the mean annual income, ,, Virginia. In a current study, a random sample of 10 teachers from Texas and an independent random sample of 10 teachers from Virginia have been asked to report their mean annual income.The data obtained are as follows. Annual income in dollars Texas 38451, 45413, 32422, 33858, 36757, 43364, 38277, 32209, 31394, 39145 Virginia 27799,33014, 45224, 43047, 45154, 28074, 32080, 39928, 42268, 23927 The population standard deviation for mean annual income of teachers in Texas and in Virginia are estimated as 6100 and 6300, respectively. It is also known that both populations are approximately normally distributed. At the 0.01 level of significance, is there sufficient evidence to reject the claim that the mean annual income of teachers in state of Texas is greater than or equal to the mean annual income of teachers in Virginia? Perform a one-tailed test. Then fill in the table below. Carry your intermediate computations to at least three decimal places and round your answers as specified in the table. (If necessary, consult a list of formulas.) The null hypothesis: H, :0 The alternative hypothesis: H, :0 The type of test statistic: |(Choose one) v S The value of the test statistic: (Round to at least three
Step by Step Solution
3.54 Rating (164 Votes )
There are 3 Steps involved in it

Get step-by-step solutions from verified subject matter experts