

Question: Case 1 (24 Marks): Wonderplayer develops video game products for consumers. In June 2012, a team of analysts issued a research report that valued Wonderplayers
Case 1 (24 Marks):
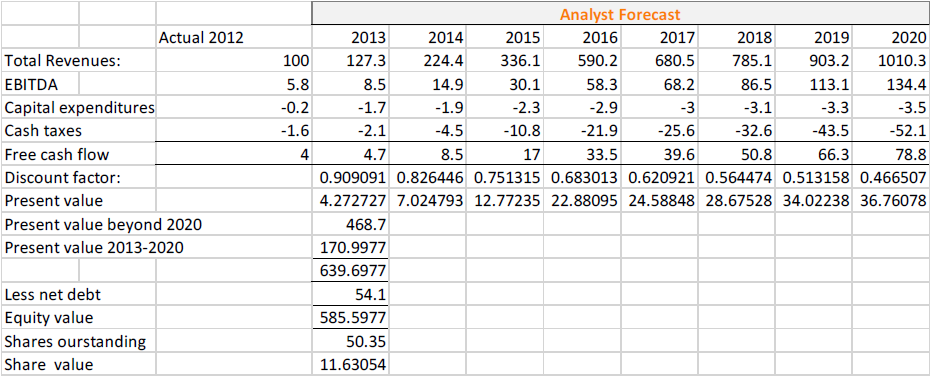
Wonderplayer develops video game products for consumers. In June 2012, a team of analysts issued a research report that valued Wonderplayers stock at $11.6 per share, compared to the then-current market price of $13. The research reports discounted cash flow valuation table is reproduced below. The 2012 figures are as reported by Wonderplayer, but the 2013 through 2020 figures are analysts forecasts. Key assumptions include a weighted average cost of capital of 10% and a perpetual growth rate of 2%. All dollar amounts are in millions except share value.
Comment on how the analyst of Wonderplayer calculate free cash flow compares with how the professional CFA might compute free cash flow directly from the companys financial statements.
Please help me answer this question thank you
Actual 2012 Total Revenues: EBITDA Capital expenditures Cash taxes Free cash flow Discount factor: Present value Present value beyond 2020 Present value 2013-2020 100 5.8 -0.2 -1.6 4 Analyst Forecast 2013 2014 2015 2016 2017 2018 2019 2020 127.3 224.4 336.1 590.2 680.5 785.1 903.2 1010.3 8.5 14.9 30.1 58.3 68.2 86.5 113.1 134.4 -1.7 -1.9 -2.3 -2.9 -3 -3.1 -3.3 -3.5 -2.1 -4.5 -10.8 -21.9 -25.6 -32.6 -43.5 -52.1 4.7 8.5 17 33.5 39.6 50.8 66.3 78.8 0.909091 0.826446 0.751315 0.683013 0.620921 0.564474 0.513158 0.466507 4.272727 7.024793 12.77235 22.88095 24.58848 28.67528 34.02238 36.76078 468.7 170.9977 639.6977 54.1 585.5977 50.35 11.63054 Less net debt Equity value Shares ourstanding Share value Actual 2012 Total Revenues: EBITDA Capital expenditures Cash taxes Free cash flow Discount factor: Present value Present value beyond 2020 Present value 2013-2020 100 5.8 -0.2 -1.6 4 Analyst Forecast 2013 2014 2015 2016 2017 2018 2019 2020 127.3 224.4 336.1 590.2 680.5 785.1 903.2 1010.3 8.5 14.9 30.1 58.3 68.2 86.5 113.1 134.4 -1.7 -1.9 -2.3 -2.9 -3 -3.1 -3.3 -3.5 -2.1 -4.5 -10.8 -21.9 -25.6 -32.6 -43.5 -52.1 4.7 8.5 17 33.5 39.6 50.8 66.3 78.8 0.909091 0.826446 0.751315 0.683013 0.620921 0.564474 0.513158 0.466507 4.272727 7.024793 12.77235 22.88095 24.58848 28.67528 34.02238 36.76078 468.7 170.9977 639.6977 54.1 585.5977 50.35 11.63054 Less net debt Equity value Shares ourstanding Share value
Step by Step Solution
There are 3 Steps involved in it

Get step-by-step solutions from verified subject matter experts