

ay Johnson sat back in his chair wondering about what he had just done. He accepted...
Fantastic news! We've Found the answer you've been seeking!
Question:

Transcribed Image Text:
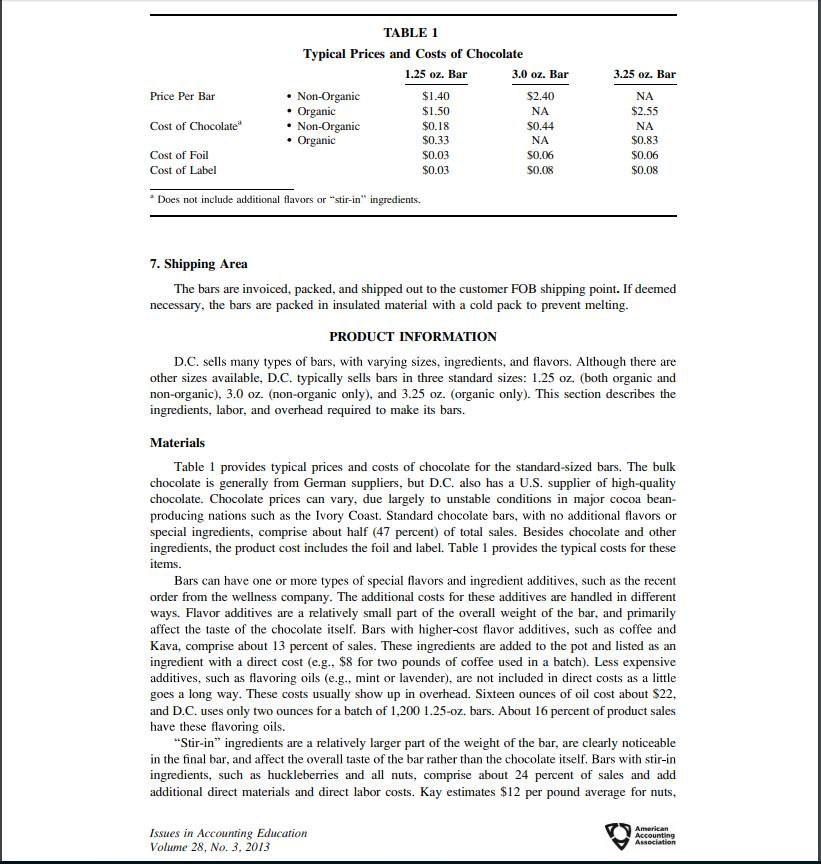
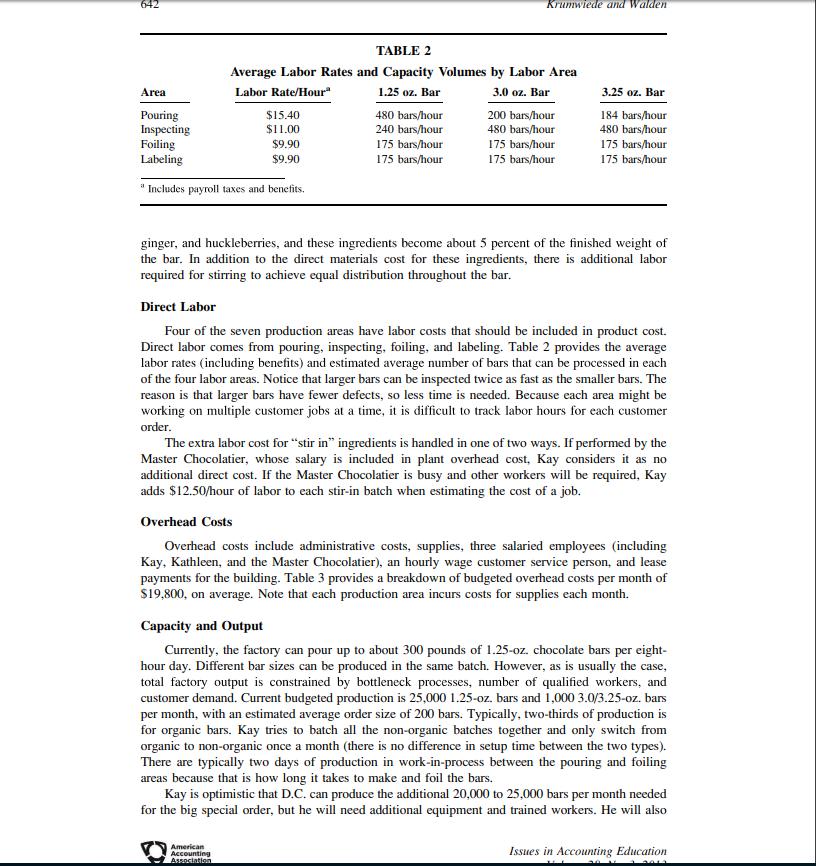
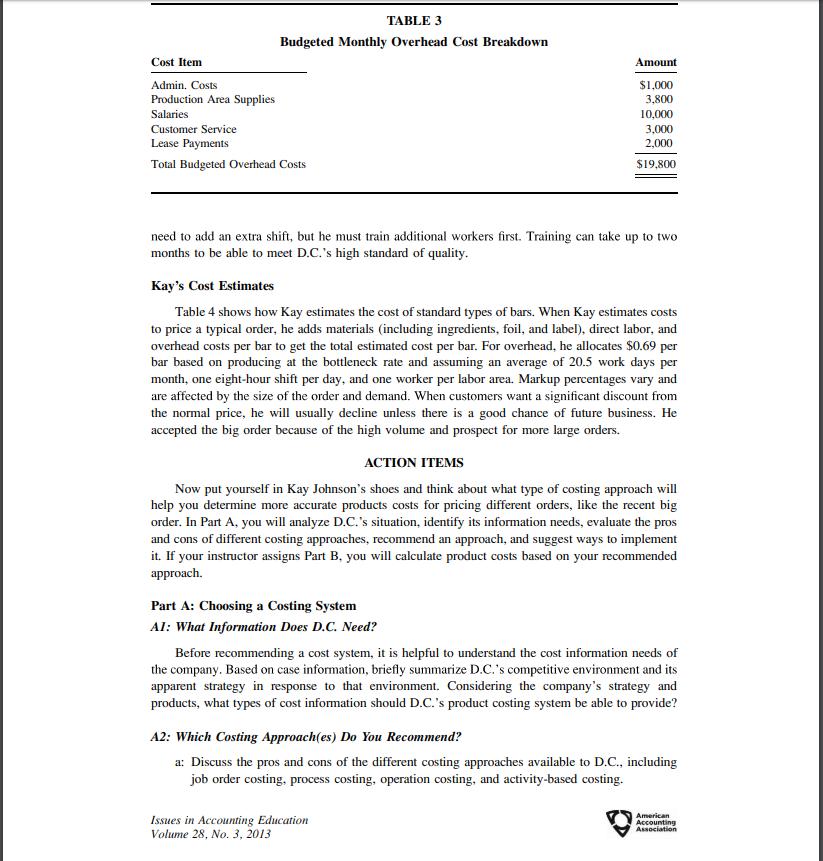
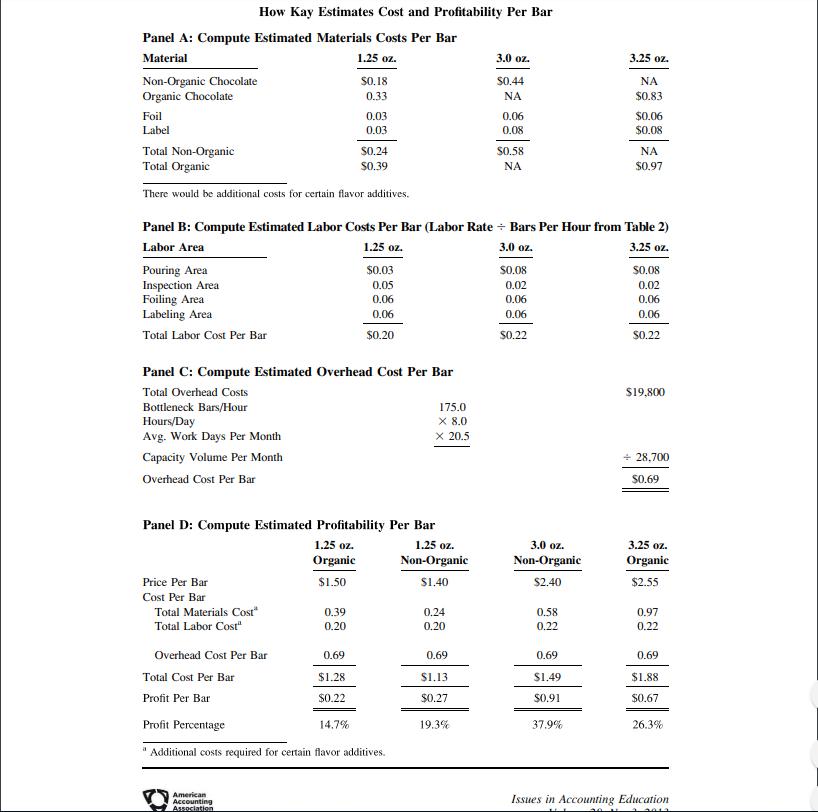
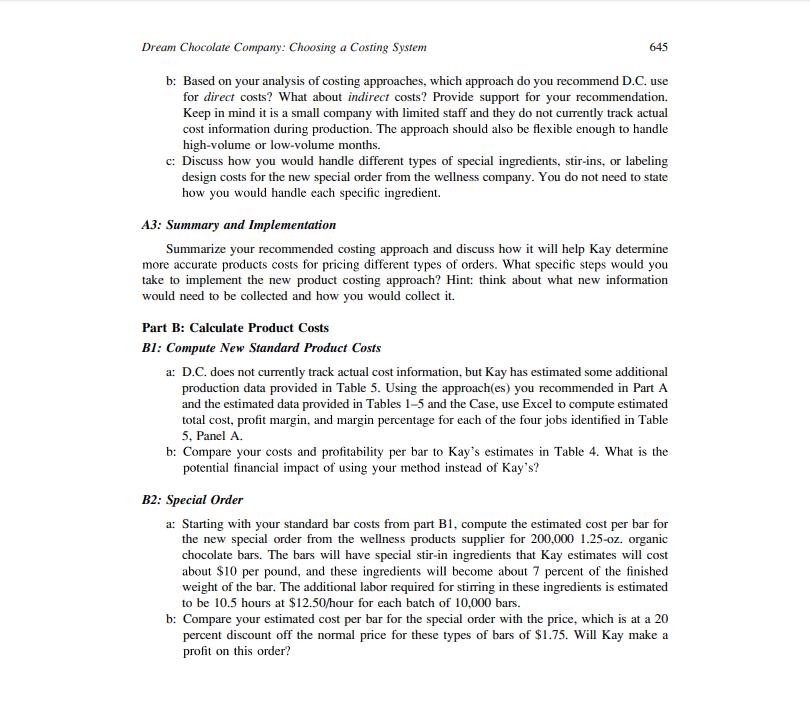
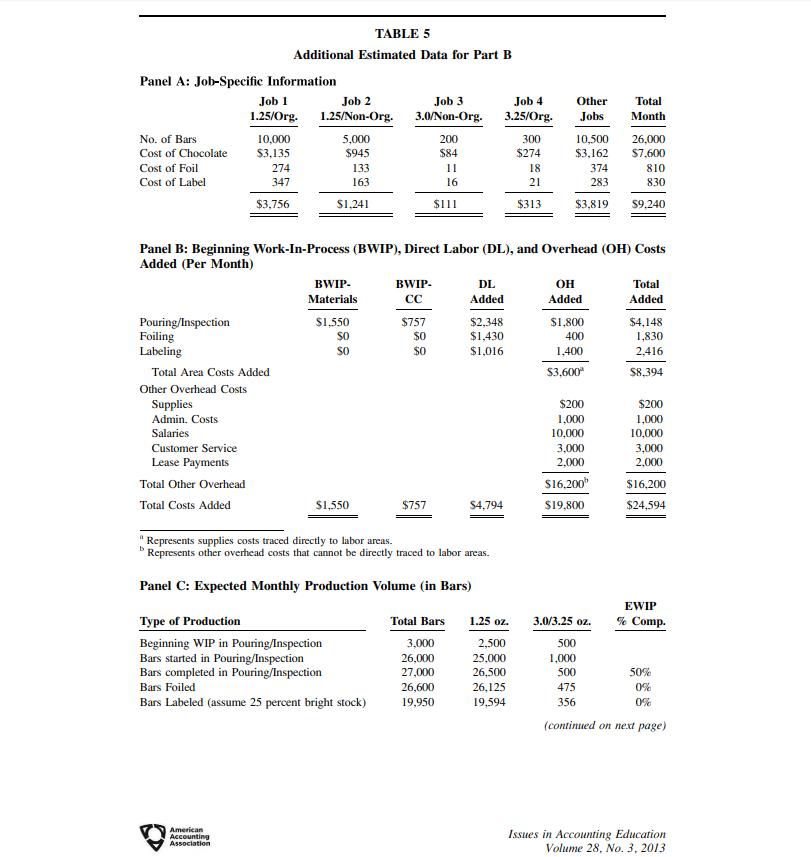
ay Johnson sat back in his chair wondering about what he had just done. He accepted a special order from a national supplier of wellness products for 200,000 chocolate bars at a K the recipe. The company also hinted about a second order for 150,000 bars if the first order was successful. Kay sighed and thought, "I hope we can make a profit on this order, because we are going to have to increase our capacity big-time to fill it. Wish I knew what the cost will be." OVERVIEW OF COMPANY Dream Chocolate (D.C.) is the major product line of Salmon River Foods, the spawn of a trip on the Middle Fork of the Salmon River in Boise, Idaho. President Kay Johnson was burned out by 30 years in the food service industry and decided to sell his business and begin anew. Quite by accident, he received a call asking if his new company Salmon River Foods would consider selling Kip R. Krumwiede and W. Darrell Walden are both Associate Professors at the University of Richmond. We thank David E. Stout, Shannon L. Charles, and Nick Fessler for helpful comments. We also thank Kay Johnson, owner of Dream Chocolate, for his support throughout the project. This case is based on a real company, but quantitative information used in the case is disguised for confidentiality purposes. Published Online: March 2013 chocolate bars. Kay's son Rob was employed by a German company and was frequently flying to Europe and returning with wonderful chocolate as family gifts. Kay wondered how he could produce European-style chocolate (no waxes or preservatives) in the U.S. With his son's help, he found a supplier in Germany who would ship to the U.S. Kay purchased a chocolate factory in Boise and began production in April 2002. Kathleen Wasson, Vice President, oversees the creative arts department and assists Kay in managing the plant. What started with one basic milk chocolate bar has grown to include two milks, two darks, two semi-sweets, one white, one bittersweet, and other adaptations involving various ingredients such as coffee, berries, and fresh mint. The chocolate is wonderful, but the real charm of the product is its custom labeling. For individual snacking, D.C. bars are sold in specialty markets, fine gift stores, and other locations. They are also available for corporate events and celebrations, such as weddings and birthdays. The website at www.dreamchocolate.com provides more information about its various product offerings. Competitive Pressures D.C. is a small company trying to survive in an industry with many players. Competition can come from the many custom chocolate bar providers on the Internet (e.g., Custom Candy Creations, Totally Chocolate, Carson Wrapped Hershey's Chocolates, to name a few), as well as from big chocolate companies (e.g., Mars, Nestlé, and Hershey's) who can always beat D.C. on price. As such, it pursues any type of order it can get. The company's niche is European-style custom chocolate bars and labeling, and it is known for its flexibility and speed. For instance, a small customer order can be printed, labeled, and ready for pickup or shipping within an hour if the company already has the label in its system. Few, if any, of D.C.'s competitors can match this turnaround time or its combination of high-quality bars, variety of flavors, and custom labeling. Lagging Sales Sales were about $500,000 in 2010. Demand was increasing in August and September 2010, which are normally weaker months due to fewer special events. This gave D.C. management great hope, but the continued national recession hurt sales in 2011 (as it did for most companies). When asked about the issues D.C. faced at that time, Kay Johnson said that: We need more business to utilize our capacity and make a profit. As we do so, the main issue will be training people. It takes up to three months to train people adequately. Also, custom labeling needs to be more effectively marketed. This is our best margin area. If we focused our business on low-margin, high-volume chocolate bars we could be vulnerable to customers dropping us for another supplier. Costing Issue It is now 2012 and D.C. is starting to get bigger orders, such as the one for 200,000 bars. D.C. bars are also now being sold in some REI' outlets around the country. As is common with small companies, Salmon River Foods has an inadequate costing system. For example, it is unable to compute actual costs per order or per bar. For pricing purposes, Kay estimates the costs of each type of bar using his experience and knowledge of ingredient prices and what he pays out each month in expenses. Each order is different, and typically ranges from 150 bars to REI is a national retail chain of outdoor clothing and equipment products (see: www.REL.com). Dream Chocolate Company: Choosing a Costing System 10,000 bars. It is difficult for the company to estimate an accurate cost for an order for pricing purposes, so he really never knows whether orders are profitable or not. Kay wondered how to accurately determine the cost for this new special order the biggest order in the company's history by far! Adding to the challenge are limited resources for more accounting work. D.C. employs an hourly wage Boise State University accounting graduate part-time to do its monthly bookkeeping (books are closed at the end of the year). A local CPA does its financial statements, taxes, and provides occasional advice. However, Kay now needs a new type of costing system to provide accurate cost estimates, and is wondering what type of costing system makes sense for his small but growing business. PRODUCTION PROCESS Making high-quality chocolate bars is a challenging process. The bulk chocolate must be melted and flavored just right before being tempered, which is a process that aligns the crystals in molten chocolate to produce the best texture balance of firm and creamy. Kay Johnson described the challenges in achieving the right formula: It's a high-end process. The chocolate is temperamental, and, much like wine, there are many different kinds, qualities, and layers of flavor. We try to make ours less sugary and more pure, so that chocolate is the first thing you taste. 639 D.C. employs a full-time Master Chocolatier, who oversees the entire production process, fills in at any area when there is a need, and performs most of the product inspections. Exhibit 1 provides a flow chart of the 3,000 square foot factory and the seven production areas, each of which are discussed next. 1. Receiving Area As soon as the bulk chocolate is received in the Receiving Area, it is dated and placed in the Imported Chocolate Storage area. Organic chocolate, which comes from a U.S. supplier, has a separate shelf from the rest of the bulk chocolate. 2. Pouring Area After the Pouring Area is cleaned and cleared of all non-organic chocolate (if necessary), the bulk chocolate is brought to the melting pots to be melted. Any flavors (e.g., mint or lavender oil) and ingredient additives (e.g., huckleberries or nuts) are added to the pots at the right time. This process consists of tempering and pouring the chocolate into molds, then moving the molds to the Cooling Tower. There are separate racks for organic and non-organic bars. 3. Inspection Area Bars are taken out of the molds on the Chocolate Breakdown Table, and the newly formed chocolate bars are placed on a rack in the Inspection Area. In the Inspection Area, the Master Chocolatier weighs the bars and visually inspects each one for flaws. Flawed bars are sent back to the Chocolate Rework Storage area to be re-melted and used again. There is very little waste in the process and no by-products. 4. Foiling Area After the chocolate is inspected, it is sent to the Foiling Area to be manually foiled. After foiling, the chocolate bars are either sent immediately to the Labeling area to be completed as "retail Issues in Accounting Education American Accounting 640 Lunch Broak Room Women's Restroom Finished Product Storage Shipping & Receiving Office Front Entry #1 Reception Sales Administration Office EXHIBIT 1 Salmon River Foods/Dream Chocolate Floor Plan Sink Wash Basin Shipping Tables American Supervisor Labeler Ana *1 Shipping Area Tables (5 Opentions Manager's Office Laminator Cutter Labeler Ana A2 Forkr Area 2 4 Lover Ara 1 Box & Label Storag Foiled Product (Bright Stock) Failed Product Storage Racks Custom Program Graphic Artist Vice President Equipment Rack Inspection A File Cabinets Men's Restroom Sank Finished Product Staging Shipping Door Shipping & Receiving Alley Krumwiede and Walden. Front Entry #2 Conference Room Xerox Laser Printer Chocolme Break Down Table Imported Chocolate Storage Ares Sales Manager Principles Office Pooring Aren Por #2 Pot Equipment Rack Cooling Tower Master Chocolatiers Desk Mold toge Chocolate Rework Slorage Finished Material Storage stock" or put on the Foiled Product shelves to be held for future orders as "bright stock." D.C. likes to keep bright stock on hand to be able to quickly fill future orders for the more common sizes and flavors. Bright stock boxes are dated and used based on first-in first-out (FIFO). 5. Labeling Area In the Labeling Area, foiled chocolate bars are manually labeled and prepared for shipping. Some retail stock orders are labeled with standard, pre-designed D.C. labels describing the flavor, type of chocolate, and possibly a theme (e.g., "The Wine-Lovers Bar" or "Think Pink Dark Chocolate"). Other orders are for "Custom Label Bars" for advertising or special events (e.g., weddings, store openings). These labels include things like company logos, photos, paintings, and even resumes and personal business cards. D.C. requires a 150-bar minimum and charges an additional amount for the custom label design costs, which can vary significantly depending on customer needs. VP Kathleen Wasson edits the many retail and custom labels produced for D.C. bars. All labels are printed on D.C.'s color laser printer. 6. Finished Product Storage Area All labeled bars are stored in the Finished Product Storage Area until shipped or picked up by customers. The company produces significant varieties of both bright stock and retail stock. There are approximately 40-plus different flavor and size variations of bright stock in storage. The retail stock has even more types of bars for different retail clients. Price Per Bar Cost of Chocolate TABLE 1 Typical Prices and Costs of Chocolate 1.25 oz. Bar Non-Organic Organic Non-Organic Organic $1.40 $1.50 $0.18 $0.33 Cost of Foil Cost of Label * Does not include additional flavors or "stir-in" ingredients. $0.03 $0.03 3.0 oz. Bar $2.40 ΝΑ $0.44 ΝΑ $0.06 $0.08 Issues in Accounting Education Volume 28, No. 3, 2013 3.25 oz. Bar ΝΑ $2.55 ΝΑ $0.83 $0.06 $0.08 7. Shipping Area The bars are invoiced, packed, and shipped out to the customer FOB shipping point. If deemed necessary, the bars are packed in insulated material with a cold pack to prevent melting. PRODUCT INFORMATION D.C. sells many types of bars, with varying sizes, ingredients, and flavors. Although there are other sizes available, D.C. typically sells bars in three standard sizes: 1.25 oz. (both organic and non-organic), 3.0 oz. (non-organic only), and 3.25 oz. (organic only). This section describes the ingredients, labor, and overhead required to make its bars. Materials Table 1 provides typical prices and costs of chocolate for the standard-sized bars. The bulk chocolate is generally from German suppliers, but D.C. also has a U.S. supplier of high-quality chocolate. Chocolate prices can vary, due largely to unstable conditions in major cocoa bean- producing nations such as the Ivory Coast. Standard chocolate bars, with no additional flavors or special ingredients, comprise about half (47 percent) of total sales. Besides chocolate and other ingredients, the product cost includes the foil and label. Table 1 provides the typical costs for these items. Bars can have one or more types of special flavors and ingredient additives, such as the recent order from the wellness company. The additional costs for these additives are handled in different ways. Flavor additives are a relatively small part of the overall weight of the bar, and primarily affect the taste of the chocolate itself. Bars with higher-cost flavor additives, such as coffee and Kava, comprise about 13 percent of sales. These ingredients are added to the pot and listed as an ingredient with a direct cost (e.g., $8 for two pounds of coffee used in a batch). Less expensive additives, such as flavoring oils (e.g., mint or lavender), are not included in direct costs as a little goes a long way. These costs usually show up in overhead. Sixteen ounces of oil cost about $22, and D.C. uses only two ounces for a batch of 1,200 1.25-oz. bars. About 16 percent of product sales have these flavoring oils. "Stir-in" ingredients are a relatively larger part of the weight of the bar, are clearly noticeable in the final bar, and affect the overall taste of the bar rather than the chocolate itself. Bars with stir-in ingredients, such as huckleberries and all nuts, comprise about 24 percent of sales and add additional direct materials and direct labor costs. Kay estimates $12 per pound average for nuts, American Accounting Association 642 Area Pouring Inspecting Foiling Labeling "Includes payroll taxes and benefits. TABLE 2 Average Labor Rates and Capacity Volumes by Labor Area Labor Rate/Hour 1.25 oz. Bar 3.0 oz. Bar $15.40 $11.00 $9.90 $9.90 Krumwiede and Walden 480 bars/hour 240 bars/hour 175 bars/hour 175 bars/hour American Accounting Association 200 bars/hour 480 bars/hour 175 bars/hour 175 bars/hour 3.25 oz. Bar 184 bars/hour 480 bars/hour 175 bars/hour 175 bars/hour ginger, and huckleberries, and these ingredients become about 5 percent of the finished weight of the bar. In addition to the direct materials cost for these ingredients, there is additional labor required for stirring to achieve equal distribution throughout the bar. Direct Labor Four of the seven production areas have labor costs that should be included in product cost. Direct labor comes from pouring, inspecting, foiling, and labeling. Table 2 provides the average labor rates (including benefits) and estimated average number of bars that can be processed in each of the four labor areas. Notice that larger bars can be inspected twice as fast as the smaller bars. The reason is that larger bars have fewer defects, so less time is needed. Because each area might be working on multiple customer jobs at a time, it is difficult to track labor hours for each customer order. The extra labor cost for "stir in" ingredients is handled in one of two ways. If performed by the Master Chocolatier, whose salary is included in plant overhead cost, Kay considers it as no additional direct cost. If the Master Chocolatier is busy and other workers will be required, Kay adds $12.50/hour of labor to each stir-in batch when estimating the cost of a job. Overhead Costs Overhead costs include administrative costs, supplies, three salaried employees (including Kay, Kathleen, and the Master Chocolatier), an hourly wage customer service person, and lease payments for the building. Table 3 provides a breakdown of budgeted overhead costs per month of $19,800, on average. Note that each production area incurs costs for supplies each month. Capacity and Output Currently, the factory can pour up to about 300 pounds of 1.25-oz. chocolate bars per eight- hour day. Different bar sizes can be produced in the same batch. However, as is usually the case, total factory output is constrained by bottleneck processes, number of qualified workers, and customer demand. Current budgeted production is 25,000 1.25-oz. bars and 1,000 3.0/3.25-oz. bars per month, with an estimated average order size of 200 bars. Typically, two-thirds of production is for organic bars. Kay tries to batch all the non-organic batches together and only switch from organic to non-organic once a month (there is no difference in setup time between the two types). There are typically two days of production in work-in-process between the pouring and foiling areas because that is how long it takes to make and foil the bars. Kay is optimistic that D.C. can produce the additional 20,000 to 25,000 bars per month needed for the big special order, but he will need additional equipment and trained workers. He will also Issues in Accounting Education TABLE 3 Budgeted Monthly Overhead Cost Breakdown Cost Item Admin. Costs Production Area Supplies Salaries Customer Service Lease Payments Total Budgeted Overhead Costs Amount $1,000 3,800 need to add an extra shift, but he must train additional workers first. Training can take up to two months to be able to meet D.C.'s high standard of quality. 10,000 3,000 2,000 $19,800 Kay's Cost Estimates Table 4 shows how Kay estimates the cost of standard types of bars. When Kay estimates costs to price a typical order, he adds materials (including ingredients, foil, and label), direct labor, and overhead costs per bar to get the total estimated cost per bar. For overhead, he allocates $0.69 per bar based on producing at the bottleneck rate and assuming an average of 20.5 work days per month, one eight-hour shift per day, and one worker per labor area. Markup percentages vary and are affected by the size of the order and demand. When customers want a significant discount from the normal price, he will usually decline unless there is a good chance of future business. He accepted the big order because of the high volume and prospect for more large orders. Part A: Choosing a Costing System AI: What Information Does D.C. Need? ACTION ITEMS Now put yourself in Kay Johnson's shoes and think about what type of costing approach will help you determine more accurate products costs for pricing different orders, like the recent big order. In Part A, you will analyze D.C.'s situation, identify its information needs, evaluate the pros and cons of different costing approaches, recommend an approach, and suggest ways to implement it. If your instructor assigns Part B, you will calculate product costs based on your recommended approach. Before recommending a cost system, it is helpful to understand the cost information needs of the company. Based on case information, briefly summarize D.C.'s competitive environment and its apparent strategy in response to that environment. Considering the company's strategy and products, what types of cost information should D.C.'s product costing system be able to provide? Issues in Accounting Education Volume 28, No. 3, 2013 A2: Which Costing Approach(es) Do You Recommend? a: Discuss the pros and cons of the different costing approaches available to D.C., including job order costing, process costing, operation costing, and activity-based costing. American Accounting Association Panel A: Compute Estimated Materials Costs Per Bar Material 1.25 oz. Non-Organic Chocolate Organic Chocolate Foil Label How Kay Estimates Cost and Profitability Per Bar Total Non-Organic Total Organic There would be additional costs for certain flavor additives. Pouring Area Inspection Area Foiling Area Labeling Area Total Labor Cost Per Bar Price Per Bar Cost Per Bar Total Materials Cost Total Labor Cost Panel C: Compute Estimated Overhead Cost Per Bar Total Overhead Costs Bottleneck Bars/Hour Hours/Day Avg. Work Days Per Month Capacity Volume Per Month Overhead Cost Per Bar Overhead Cost Per Bar $0.18 0.33 American Accounting Association 0.03 0.03 Panel D: Compute Estimated Profitability Per Bar 1.25 oz. 1.25 oz. Organic Non-Organic $1.40 $1.50 0.39 0.20 0.69 $1.28 $0.22 $0.24 $0.39 Panel B: Compute Estimated Labor Costs Per Bar (Labor Rate Bars Per Hour from Table 2) Labor Area 1.25 oz. 3.0 oz. 3.25 oz. 14.7% $0.03 0.05 0.06 0.06 $0.20 Total Cost Per Bar Profit Per Bar Profit Percentage "Additional costs required for certain flavor additives. 175.0 X 8.0 x 20.5 0.24 0.20 3.0 oz. $0.44 ΝΑ 0.69 $1.13 $0.27 19.3% 0.06 0.08 $0.58 NA $0.08 0.02 0.06 0.06 $0.22 3.0 oz. Non-Organic $2.40 0.58 0.22 3.25 oz. 0.69 $1.49 $0.91 37.9% ΝΑ $0.83 $0.06 $0.08 ΝΑ $0.97 $0.08 0.02 0.06 0.06 $0.22 $19,800 + 28,700 $0.69 3.25 oz. Organic $2.55 0.97 0.22 0.69 $1.88 $0.67 26.3% Issues in Accounting Education 2013 Dream Chocolate Company: Choosing a Costing System b: Based on your analysis of costing approaches, which approach do you recommend D.C. use for direct costs? What about indirect costs? Provide support for your recommendation. Keep in mind it is a small company with limited staff and they do not currently track actual cost information during production. The approach should also be flexible enough to handle high-volume or low-volume months. 645 c: Discuss how you would handle different types of special ingredients, stir-ins, or labeling design costs for the new special order from the wellness company. You do not need to state how you would handle each specific ingredient. A3: Summary and Implementation Summarize your recommended costing approach and discuss how it will help Kay determine more accurate products costs for pricing different types of orders. What specific steps would you take to implement the new product costing approach? Hint: think about what new information would need to be collected and how you would collect it. Part B: Calculate Product Costs B1: Compute New Standard Product Costs a: D.C. does not currently track actual cost information, but Kay has estimated some additional production data provided in Table 5. Using the approach(es) you recommended in Part A and the estimated data provided in Tables 1-5 and the Case, use Excel to compute estimated total cost, profit margin, and margin percentage for each of the four jobs identified in Table 5, Panel A. b: Compare your costs and profitability per bar to Kay's estimates in Table 4. What is the potential financial impact of using your method instead of Kay's? B2: Special Order a: Starting with your standard bar costs from part B1, compute the estimated cost per bar for the new special order from the wellness products supplier for 200,000 1.25-oz. organic chocolate bars. The bars will have special stir-in ingredients that Kay estimates will cost about $10 per pound, and these ingredients will become about 7 percent of the finished weight of the bar. The additional labor required for stirring in these ingredients is estimated to be 10.5 hours at $12.50/hour for each batch of 10,000 bars. b: Compare your estimated cost per bar for the special order with the price, which is at a 20 percent discount off the normal price for these types of bars of $1.75. Will Kay make a profit on this order? Panel A: Job-Specific Information Job 1 1.25/Org. No. of Bars Cost of Chocolate Cost of Foil Cost of Label Pouring/Inspection Foiling Labeling Supplies Admin. Costs Salaries Customer Service Lease Payments 10,000 $3,135 Total Area Costs Added Other Overhead Costs Total Other Overhead Total Costs Added 274 347 $3,756 TABLE 5 Additional Estimated Data for Part B Job 2 1.25/Non-Org. American Accounting Association 5,000 $945 133 163 $1,241 BWIP. Materials $1,550 SO SO $1,550 Job 3 3.0/Non-Org. Panel B: Beginning Work-In-Process (BWIP), Direct Labor (DL), and Overhead (OH) Costs Added (Per Month) Type of Production Beginning WIP in Pouring/Inspection Bars started in Pouring/Inspection Bars completed in Pouring/Inspection Bars Foiled Bars Labeled (assume 25 percent bright stock) 200 $84 11 16 $111 BWIP- CC $757 $0 $0 $757 a Represents supplies costs traced directly to labor areas. b Represents other overhead costs that cannot be directly traced to labor areas. DL Added Panel C: Expected Monthly Production Volume (in Bars) Total Bars 3,000 26,000 27,000 26,600 19,950 $2,348 $1,430 $1,016 $4,794 Job 4 3.25/Org. 300 $274 18 21 $313 1.25 oz. 2,500 25,000 26,500 26,125 19,594 Other Jobs 10,500 $3,162 374 810 283 830 $3,819 $9,240 OH Added $1,800 400 1,400 $3,600 Total Month $200 1,000 10,000 3,000 2.000 $16,200" $19,800 26,000 $7,600 3.0/3.25 oz. Total Added $4,148 1,830 2,416 $8,394 $200 1,000 10,000 3,000 2,000 $16,200 $24,594 EWIP % Comp. 500 1,000 500 475 356 (continued on next page) 50% 0% 0% Issues in Accounting Education Volume 28, No. 3, 2013 ay Johnson sat back in his chair wondering about what he had just done. He accepted a special order from a national supplier of wellness products for 200,000 chocolate bars at a K the recipe. The company also hinted about a second order for 150,000 bars if the first order was successful. Kay sighed and thought, "I hope we can make a profit on this order, because we are going to have to increase our capacity big-time to fill it. Wish I knew what the cost will be." OVERVIEW OF COMPANY Dream Chocolate (D.C.) is the major product line of Salmon River Foods, the spawn of a trip on the Middle Fork of the Salmon River in Boise, Idaho. President Kay Johnson was burned out by 30 years in the food service industry and decided to sell his business and begin anew. Quite by accident, he received a call asking if his new company Salmon River Foods would consider selling Kip R. Krumwiede and W. Darrell Walden are both Associate Professors at the University of Richmond. We thank David E. Stout, Shannon L. Charles, and Nick Fessler for helpful comments. We also thank Kay Johnson, owner of Dream Chocolate, for his support throughout the project. This case is based on a real company, but quantitative information used in the case is disguised for confidentiality purposes. Published Online: March 2013 chocolate bars. Kay's son Rob was employed by a German company and was frequently flying to Europe and returning with wonderful chocolate as family gifts. Kay wondered how he could produce European-style chocolate (no waxes or preservatives) in the U.S. With his son's help, he found a supplier in Germany who would ship to the U.S. Kay purchased a chocolate factory in Boise and began production in April 2002. Kathleen Wasson, Vice President, oversees the creative arts department and assists Kay in managing the plant. What started with one basic milk chocolate bar has grown to include two milks, two darks, two semi-sweets, one white, one bittersweet, and other adaptations involving various ingredients such as coffee, berries, and fresh mint. The chocolate is wonderful, but the real charm of the product is its custom labeling. For individual snacking, D.C. bars are sold in specialty markets, fine gift stores, and other locations. They are also available for corporate events and celebrations, such as weddings and birthdays. The website at www.dreamchocolate.com provides more information about its various product offerings. Competitive Pressures D.C. is a small company trying to survive in an industry with many players. Competition can come from the many custom chocolate bar providers on the Internet (e.g., Custom Candy Creations, Totally Chocolate, Carson Wrapped Hershey's Chocolates, to name a few), as well as from big chocolate companies (e.g., Mars, Nestlé, and Hershey's) who can always beat D.C. on price. As such, it pursues any type of order it can get. The company's niche is European-style custom chocolate bars and labeling, and it is known for its flexibility and speed. For instance, a small customer order can be printed, labeled, and ready for pickup or shipping within an hour if the company already has the label in its system. Few, if any, of D.C.'s competitors can match this turnaround time or its combination of high-quality bars, variety of flavors, and custom labeling. Lagging Sales Sales were about $500,000 in 2010. Demand was increasing in August and September 2010, which are normally weaker months due to fewer special events. This gave D.C. management great hope, but the continued national recession hurt sales in 2011 (as it did for most companies). When asked about the issues D.C. faced at that time, Kay Johnson said that: We need more business to utilize our capacity and make a profit. As we do so, the main issue will be training people. It takes up to three months to train people adequately. Also, custom labeling needs to be more effectively marketed. This is our best margin area. If we focused our business on low-margin, high-volume chocolate bars we could be vulnerable to customers dropping us for another supplier. Costing Issue It is now 2012 and D.C. is starting to get bigger orders, such as the one for 200,000 bars. D.C. bars are also now being sold in some REI' outlets around the country. As is common with small companies, Salmon River Foods has an inadequate costing system. For example, it is unable to compute actual costs per order or per bar. For pricing purposes, Kay estimates the costs of each type of bar using his experience and knowledge of ingredient prices and what he pays out each month in expenses. Each order is different, and typically ranges from 150 bars to REI is a national retail chain of outdoor clothing and equipment products (see: www.REL.com). Dream Chocolate Company: Choosing a Costing System 10,000 bars. It is difficult for the company to estimate an accurate cost for an order for pricing purposes, so he really never knows whether orders are profitable or not. Kay wondered how to accurately determine the cost for this new special order the biggest order in the company's history by far! Adding to the challenge are limited resources for more accounting work. D.C. employs an hourly wage Boise State University accounting graduate part-time to do its monthly bookkeeping (books are closed at the end of the year). A local CPA does its financial statements, taxes, and provides occasional advice. However, Kay now needs a new type of costing system to provide accurate cost estimates, and is wondering what type of costing system makes sense for his small but growing business. PRODUCTION PROCESS Making high-quality chocolate bars is a challenging process. The bulk chocolate must be melted and flavored just right before being tempered, which is a process that aligns the crystals in molten chocolate to produce the best texture balance of firm and creamy. Kay Johnson described the challenges in achieving the right formula: It's a high-end process. The chocolate is temperamental, and, much like wine, there are many different kinds, qualities, and layers of flavor. We try to make ours less sugary and more pure, so that chocolate is the first thing you taste. 639 D.C. employs a full-time Master Chocolatier, who oversees the entire production process, fills in at any area when there is a need, and performs most of the product inspections. Exhibit 1 provides a flow chart of the 3,000 square foot factory and the seven production areas, each of which are discussed next. 1. Receiving Area As soon as the bulk chocolate is received in the Receiving Area, it is dated and placed in the Imported Chocolate Storage area. Organic chocolate, which comes from a U.S. supplier, has a separate shelf from the rest of the bulk chocolate. 2. Pouring Area After the Pouring Area is cleaned and cleared of all non-organic chocolate (if necessary), the bulk chocolate is brought to the melting pots to be melted. Any flavors (e.g., mint or lavender oil) and ingredient additives (e.g., huckleberries or nuts) are added to the pots at the right time. This process consists of tempering and pouring the chocolate into molds, then moving the molds to the Cooling Tower. There are separate racks for organic and non-organic bars. 3. Inspection Area Bars are taken out of the molds on the Chocolate Breakdown Table, and the newly formed chocolate bars are placed on a rack in the Inspection Area. In the Inspection Area, the Master Chocolatier weighs the bars and visually inspects each one for flaws. Flawed bars are sent back to the Chocolate Rework Storage area to be re-melted and used again. There is very little waste in the process and no by-products. 4. Foiling Area After the chocolate is inspected, it is sent to the Foiling Area to be manually foiled. After foiling, the chocolate bars are either sent immediately to the Labeling area to be completed as "retail Issues in Accounting Education American Accounting 640 Lunch Broak Room Women's Restroom Finished Product Storage Shipping & Receiving Office Front Entry #1 Reception Sales Administration Office EXHIBIT 1 Salmon River Foods/Dream Chocolate Floor Plan Sink Wash Basin Shipping Tables American Supervisor Labeler Ana *1 Shipping Area Tables (5 Opentions Manager's Office Laminator Cutter Labeler Ana A2 Forkr Area 2 4 Lover Ara 1 Box & Label Storag Foiled Product (Bright Stock) Failed Product Storage Racks Custom Program Graphic Artist Vice President Equipment Rack Inspection A File Cabinets Men's Restroom Sank Finished Product Staging Shipping Door Shipping & Receiving Alley Krumwiede and Walden. Front Entry #2 Conference Room Xerox Laser Printer Chocolme Break Down Table Imported Chocolate Storage Ares Sales Manager Principles Office Pooring Aren Por #2 Pot Equipment Rack Cooling Tower Master Chocolatiers Desk Mold toge Chocolate Rework Slorage Finished Material Storage stock" or put on the Foiled Product shelves to be held for future orders as "bright stock." D.C. likes to keep bright stock on hand to be able to quickly fill future orders for the more common sizes and flavors. Bright stock boxes are dated and used based on first-in first-out (FIFO). 5. Labeling Area In the Labeling Area, foiled chocolate bars are manually labeled and prepared for shipping. Some retail stock orders are labeled with standard, pre-designed D.C. labels describing the flavor, type of chocolate, and possibly a theme (e.g., "The Wine-Lovers Bar" or "Think Pink Dark Chocolate"). Other orders are for "Custom Label Bars" for advertising or special events (e.g., weddings, store openings). These labels include things like company logos, photos, paintings, and even resumes and personal business cards. D.C. requires a 150-bar minimum and charges an additional amount for the custom label design costs, which can vary significantly depending on customer needs. VP Kathleen Wasson edits the many retail and custom labels produced for D.C. bars. All labels are printed on D.C.'s color laser printer. 6. Finished Product Storage Area All labeled bars are stored in the Finished Product Storage Area until shipped or picked up by customers. The company produces significant varieties of both bright stock and retail stock. There are approximately 40-plus different flavor and size variations of bright stock in storage. The retail stock has even more types of bars for different retail clients. Price Per Bar Cost of Chocolate TABLE 1 Typical Prices and Costs of Chocolate 1.25 oz. Bar Non-Organic Organic Non-Organic Organic $1.40 $1.50 $0.18 $0.33 Cost of Foil Cost of Label * Does not include additional flavors or "stir-in" ingredients. $0.03 $0.03 3.0 oz. Bar $2.40 ΝΑ $0.44 ΝΑ $0.06 $0.08 Issues in Accounting Education Volume 28, No. 3, 2013 3.25 oz. Bar ΝΑ $2.55 ΝΑ $0.83 $0.06 $0.08 7. Shipping Area The bars are invoiced, packed, and shipped out to the customer FOB shipping point. If deemed necessary, the bars are packed in insulated material with a cold pack to prevent melting. PRODUCT INFORMATION D.C. sells many types of bars, with varying sizes, ingredients, and flavors. Although there are other sizes available, D.C. typically sells bars in three standard sizes: 1.25 oz. (both organic and non-organic), 3.0 oz. (non-organic only), and 3.25 oz. (organic only). This section describes the ingredients, labor, and overhead required to make its bars. Materials Table 1 provides typical prices and costs of chocolate for the standard-sized bars. The bulk chocolate is generally from German suppliers, but D.C. also has a U.S. supplier of high-quality chocolate. Chocolate prices can vary, due largely to unstable conditions in major cocoa bean- producing nations such as the Ivory Coast. Standard chocolate bars, with no additional flavors or special ingredients, comprise about half (47 percent) of total sales. Besides chocolate and other ingredients, the product cost includes the foil and label. Table 1 provides the typical costs for these items. Bars can have one or more types of special flavors and ingredient additives, such as the recent order from the wellness company. The additional costs for these additives are handled in different ways. Flavor additives are a relatively small part of the overall weight of the bar, and primarily affect the taste of the chocolate itself. Bars with higher-cost flavor additives, such as coffee and Kava, comprise about 13 percent of sales. These ingredients are added to the pot and listed as an ingredient with a direct cost (e.g., $8 for two pounds of coffee used in a batch). Less expensive additives, such as flavoring oils (e.g., mint or lavender), are not included in direct costs as a little goes a long way. These costs usually show up in overhead. Sixteen ounces of oil cost about $22, and D.C. uses only two ounces for a batch of 1,200 1.25-oz. bars. About 16 percent of product sales have these flavoring oils. "Stir-in" ingredients are a relatively larger part of the weight of the bar, are clearly noticeable in the final bar, and affect the overall taste of the bar rather than the chocolate itself. Bars with stir-in ingredients, such as huckleberries and all nuts, comprise about 24 percent of sales and add additional direct materials and direct labor costs. Kay estimates $12 per pound average for nuts, American Accounting Association 642 Area Pouring Inspecting Foiling Labeling "Includes payroll taxes and benefits. TABLE 2 Average Labor Rates and Capacity Volumes by Labor Area Labor Rate/Hour 1.25 oz. Bar 3.0 oz. Bar $15.40 $11.00 $9.90 $9.90 Krumwiede and Walden 480 bars/hour 240 bars/hour 175 bars/hour 175 bars/hour American Accounting Association 200 bars/hour 480 bars/hour 175 bars/hour 175 bars/hour 3.25 oz. Bar 184 bars/hour 480 bars/hour 175 bars/hour 175 bars/hour ginger, and huckleberries, and these ingredients become about 5 percent of the finished weight of the bar. In addition to the direct materials cost for these ingredients, there is additional labor required for stirring to achieve equal distribution throughout the bar. Direct Labor Four of the seven production areas have labor costs that should be included in product cost. Direct labor comes from pouring, inspecting, foiling, and labeling. Table 2 provides the average labor rates (including benefits) and estimated average number of bars that can be processed in each of the four labor areas. Notice that larger bars can be inspected twice as fast as the smaller bars. The reason is that larger bars have fewer defects, so less time is needed. Because each area might be working on multiple customer jobs at a time, it is difficult to track labor hours for each customer order. The extra labor cost for "stir in" ingredients is handled in one of two ways. If performed by the Master Chocolatier, whose salary is included in plant overhead cost, Kay considers it as no additional direct cost. If the Master Chocolatier is busy and other workers will be required, Kay adds $12.50/hour of labor to each stir-in batch when estimating the cost of a job. Overhead Costs Overhead costs include administrative costs, supplies, three salaried employees (including Kay, Kathleen, and the Master Chocolatier), an hourly wage customer service person, and lease payments for the building. Table 3 provides a breakdown of budgeted overhead costs per month of $19,800, on average. Note that each production area incurs costs for supplies each month. Capacity and Output Currently, the factory can pour up to about 300 pounds of 1.25-oz. chocolate bars per eight- hour day. Different bar sizes can be produced in the same batch. However, as is usually the case, total factory output is constrained by bottleneck processes, number of qualified workers, and customer demand. Current budgeted production is 25,000 1.25-oz. bars and 1,000 3.0/3.25-oz. bars per month, with an estimated average order size of 200 bars. Typically, two-thirds of production is for organic bars. Kay tries to batch all the non-organic batches together and only switch from organic to non-organic once a month (there is no difference in setup time between the two types). There are typically two days of production in work-in-process between the pouring and foiling areas because that is how long it takes to make and foil the bars. Kay is optimistic that D.C. can produce the additional 20,000 to 25,000 bars per month needed for the big special order, but he will need additional equipment and trained workers. He will also Issues in Accounting Education TABLE 3 Budgeted Monthly Overhead Cost Breakdown Cost Item Admin. Costs Production Area Supplies Salaries Customer Service Lease Payments Total Budgeted Overhead Costs Amount $1,000 3,800 need to add an extra shift, but he must train additional workers first. Training can take up to two months to be able to meet D.C.'s high standard of quality. 10,000 3,000 2,000 $19,800 Kay's Cost Estimates Table 4 shows how Kay estimates the cost of standard types of bars. When Kay estimates costs to price a typical order, he adds materials (including ingredients, foil, and label), direct labor, and overhead costs per bar to get the total estimated cost per bar. For overhead, he allocates $0.69 per bar based on producing at the bottleneck rate and assuming an average of 20.5 work days per month, one eight-hour shift per day, and one worker per labor area. Markup percentages vary and are affected by the size of the order and demand. When customers want a significant discount from the normal price, he will usually decline unless there is a good chance of future business. He accepted the big order because of the high volume and prospect for more large orders. Part A: Choosing a Costing System AI: What Information Does D.C. Need? ACTION ITEMS Now put yourself in Kay Johnson's shoes and think about what type of costing approach will help you determine more accurate products costs for pricing different orders, like the recent big order. In Part A, you will analyze D.C.'s situation, identify its information needs, evaluate the pros and cons of different costing approaches, recommend an approach, and suggest ways to implement it. If your instructor assigns Part B, you will calculate product costs based on your recommended approach. Before recommending a cost system, it is helpful to understand the cost information needs of the company. Based on case information, briefly summarize D.C.'s competitive environment and its apparent strategy in response to that environment. Considering the company's strategy and products, what types of cost information should D.C.'s product costing system be able to provide? Issues in Accounting Education Volume 28, No. 3, 2013 A2: Which Costing Approach(es) Do You Recommend? a: Discuss the pros and cons of the different costing approaches available to D.C., including job order costing, process costing, operation costing, and activity-based costing. American Accounting Association Panel A: Compute Estimated Materials Costs Per Bar Material 1.25 oz. Non-Organic Chocolate Organic Chocolate Foil Label How Kay Estimates Cost and Profitability Per Bar Total Non-Organic Total Organic There would be additional costs for certain flavor additives. Pouring Area Inspection Area Foiling Area Labeling Area Total Labor Cost Per Bar Price Per Bar Cost Per Bar Total Materials Cost Total Labor Cost Panel C: Compute Estimated Overhead Cost Per Bar Total Overhead Costs Bottleneck Bars/Hour Hours/Day Avg. Work Days Per Month Capacity Volume Per Month Overhead Cost Per Bar Overhead Cost Per Bar $0.18 0.33 American Accounting Association 0.03 0.03 Panel D: Compute Estimated Profitability Per Bar 1.25 oz. 1.25 oz. Organic Non-Organic $1.40 $1.50 0.39 0.20 0.69 $1.28 $0.22 $0.24 $0.39 Panel B: Compute Estimated Labor Costs Per Bar (Labor Rate Bars Per Hour from Table 2) Labor Area 1.25 oz. 3.0 oz. 3.25 oz. 14.7% $0.03 0.05 0.06 0.06 $0.20 Total Cost Per Bar Profit Per Bar Profit Percentage "Additional costs required for certain flavor additives. 175.0 X 8.0 x 20.5 0.24 0.20 3.0 oz. $0.44 ΝΑ 0.69 $1.13 $0.27 19.3% 0.06 0.08 $0.58 NA $0.08 0.02 0.06 0.06 $0.22 3.0 oz. Non-Organic $2.40 0.58 0.22 3.25 oz. 0.69 $1.49 $0.91 37.9% ΝΑ $0.83 $0.06 $0.08 ΝΑ $0.97 $0.08 0.02 0.06 0.06 $0.22 $19,800 + 28,700 $0.69 3.25 oz. Organic $2.55 0.97 0.22 0.69 $1.88 $0.67 26.3% Issues in Accounting Education 2013 Dream Chocolate Company: Choosing a Costing System b: Based on your analysis of costing approaches, which approach do you recommend D.C. use for direct costs? What about indirect costs? Provide support for your recommendation. Keep in mind it is a small company with limited staff and they do not currently track actual cost information during production. The approach should also be flexible enough to handle high-volume or low-volume months. 645 c: Discuss how you would handle different types of special ingredients, stir-ins, or labeling design costs for the new special order from the wellness company. You do not need to state how you would handle each specific ingredient. A3: Summary and Implementation Summarize your recommended costing approach and discuss how it will help Kay determine more accurate products costs for pricing different types of orders. What specific steps would you take to implement the new product costing approach? Hint: think about what new information would need to be collected and how you would collect it. Part B: Calculate Product Costs B1: Compute New Standard Product Costs a: D.C. does not currently track actual cost information, but Kay has estimated some additional production data provided in Table 5. Using the approach(es) you recommended in Part A and the estimated data provided in Tables 1-5 and the Case, use Excel to compute estimated total cost, profit margin, and margin percentage for each of the four jobs identified in Table 5, Panel A. b: Compare your costs and profitability per bar to Kay's estimates in Table 4. What is the potential financial impact of using your method instead of Kay's? B2: Special Order a: Starting with your standard bar costs from part B1, compute the estimated cost per bar for the new special order from the wellness products supplier for 200,000 1.25-oz. organic chocolate bars. The bars will have special stir-in ingredients that Kay estimates will cost about $10 per pound, and these ingredients will become about 7 percent of the finished weight of the bar. The additional labor required for stirring in these ingredients is estimated to be 10.5 hours at $12.50/hour for each batch of 10,000 bars. b: Compare your estimated cost per bar for the special order with the price, which is at a 20 percent discount off the normal price for these types of bars of $1.75. Will Kay make a profit on this order? Panel A: Job-Specific Information Job 1 1.25/Org. No. of Bars Cost of Chocolate Cost of Foil Cost of Label Pouring/Inspection Foiling Labeling Supplies Admin. Costs Salaries Customer Service Lease Payments 10,000 $3,135 Total Area Costs Added Other Overhead Costs Total Other Overhead Total Costs Added 274 347 $3,756 TABLE 5 Additional Estimated Data for Part B Job 2 1.25/Non-Org. American Accounting Association 5,000 $945 133 163 $1,241 BWIP. Materials $1,550 SO SO $1,550 Job 3 3.0/Non-Org. Panel B: Beginning Work-In-Process (BWIP), Direct Labor (DL), and Overhead (OH) Costs Added (Per Month) Type of Production Beginning WIP in Pouring/Inspection Bars started in Pouring/Inspection Bars completed in Pouring/Inspection Bars Foiled Bars Labeled (assume 25 percent bright stock) 200 $84 11 16 $111 BWIP- CC $757 $0 $0 $757 a Represents supplies costs traced directly to labor areas. b Represents other overhead costs that cannot be directly traced to labor areas. DL Added Panel C: Expected Monthly Production Volume (in Bars) Total Bars 3,000 26,000 27,000 26,600 19,950 $2,348 $1,430 $1,016 $4,794 Job 4 3.25/Org. 300 $274 18 21 $313 1.25 oz. 2,500 25,000 26,500 26,125 19,594 Other Jobs 10,500 $3,162 374 810 283 830 $3,819 $9,240 OH Added $1,800 400 1,400 $3,600 Total Month $200 1,000 10,000 3,000 2.000 $16,200" $19,800 26,000 $7,600 3.0/3.25 oz. Total Added $4,148 1,830 2,416 $8,394 $200 1,000 10,000 3,000 2,000 $16,200 $24,594 EWIP % Comp. 500 1,000 500 475 356 (continued on next page) 50% 0% 0% Issues in Accounting Education Volume 28, No. 3, 2013
Expert Answer:
Answer rating: 100% (QA)
more Computation Building Expected Rental Value Municipal value or Fa... View the full answer

Related Book For 

Vector Mechanics for Engineers Statics and Dynamics
ISBN: 978-0073212227
8th Edition
Authors: Ferdinand Beer, E. Russell Johnston, Jr., Elliot Eisenberg, William Clausen, David Mazurek, Phillip Cornwell
Posted Date:
Students also viewed these accounting questions
-
On a typical Intel 8086-based system, connected via system bus to DRAM memory, for a read operation, is activated by the trailing edge of the Address Enable signal (Figure 3.19). However, due to...
-
Case Study on Sigma Marketing. This case study assignment focuses on two points, the key Marketing Strategy issues facing a company and how it should proceed given the circumstances. Marketing...
-
Writing and Presenting a Research Report As Brown, Suter, and Churchill (2014) indicate in the Basic Marketing Research textbook, a marketing researcher will almost always be expected to develop a...
-
Steve Jobs wrote some Python code to determine if Apple met its quota for the Apple Newton. What does his code below output? quota = 10000000 newton 5000000 print("Welcome to Mac") if newton quota:...
-
Update the time series in Section 13.3 and for each of the three series, compute a 1-step-ahead volatility forecast by implementing MA and EWMA.
-
Two assets with expected rates of return $\bar{r}_{1}$ and $\bar{r}_{2}$ have identical variances and a known correlation coefficient $ho$. There is a risk-free asset with rate of return $r_{f}$. (a)...
-
The total sum of squares is given by \(\sum_{i=1}^{k} \sum_{j=1}^{r}\left(y_{i j}-\bar{y} ight)^{2}\) where the overall mean \(\bar{y}=\sum_{i=1}^{k} \sum_{j=1}^{r}\left(y_{i j} / n ight)\). With...
-
Included in the December 31, 2012, Jacobi Company balance sheet was the following shareholders' equity section: The company engaged in the following stock transactions during 2013: Jan. 4 Paid the...
-
A building is to be cooled in the summer season in a hot and dry region where the outdoor design conditions are 110 oF DB and 65 oF WB. The building sensible and latent heat gains are 300,000 Btu/h...
-
Kepler's second law states that as a planet moves around in its orbit, it sweeps out equal areas in equal times. Examine the following figure, which shows a planet (blue dot, labeled "E"), orbiting...
-
--cannot be canceled or amended without the beneficiary's consent. Select one: O a. Drafts O b. Letters of Credit O c. Revocable letter of credit O d. Irrevocable letter of credit
-
A gas turbine engine operates between minimum temperature \(T_{1}\) and maximum temperature \(T_{3}\). Show that the optimum pressure ratio for maximum work output is...
-
The joint cumulative distribution function for ( X , Y ) ( X , Y ) is given by F ( x , y ) = ( 1 e x / 10 e y / 2 + e ( x + 5 y ) / 10 ) I ( 0 , ) ( x ) I ( 0 , ) ( y ) F ( x , y ) = ( 1 e x...
-
One mechanism for resisting replay attacks in password authentication is to use one-time passwords: a list of passwords is prepared, and once password[N] has been accepted, the server decrements N...
-
Suppose we have a compression function c, which takes a bit string s to a compressed string c(s). (a) Show that for any integer N, there must be a string s of length N for which length(c(s)) N; that...
-
We have just introduced Parisian down-and-in options with a call feature, denoted here C D I P a C D I P a . One can also define Parisian up-and-in options P UIPa P UIPa with a put feature, i.e.,...
-
Given the following figure and information, solve for the following: A. The working matrix of the system of differential equations; B. The mathematical model for the amt. of salt in each of the tanks...
-
Apply Jacobis method to the given system. Take the zero vector as the initial approximation and work with four-significant-digit accuracy until two successive iterates agree within 0.001 in each...
-
A couple of magnitude 50lb ft is applied to the drum. Determine the smallest force that must be exerted by the hydraulic cylinder if the drum is not to rotate when the applied couple is directed (a)...
-
Steel framing members AB, BC, and CD are joined at B and C and are braced using cables EF and EG. Knowing that E is at the midpoint of BC and that the tension in cable EG is 178 lb, determine (a) The...
-
A 15-mm-diameter hole is drilled in a piece of 20-mm-thick steel; the hole is then countersunk as shown. Determine the volume of steel removed during the countersinking process. 90 25 mm- - 20 mam 15...
-
A4-stroke, 4-cylinder, single acting spark ignition petrol engine develops \(20 \mathrm{~kW}\) brake power at \(3000 \mathrm{rpm}\). The following data are given : Bore \(=65 \mathrm{~mm}\), Stroke...
-
A six cylinder four stroke I.C. Engine is to develop \(100 \mathrm{~kW}\) i.p. at 800 RPM. The stroke to bare ratio is 1.25. Assuming Mechanical efficiency of \(80 \%\) and break mean effective...
-
The following data is available for a four stroke petrol engine stroke volume \(=6\) Litres. Mean effective pressure \(=6\) bar. Speed of engine \(=750\) RPM. Calculate i.p. of the engine.

Study smarter with the SolutionInn App