

Question: CASE 15 Tiffany & Co. and TJX: Comparing Financial Performance Calculate the following for both Tiffany and TJX using data from the abbreviated income statements
CASE 15 Tiffany & Co. and TJX: Comparing Financial Performance
- Calculate the following for both Tiffany and TJX using data from the abbreviated income statements and balance sheets in Exhibit 1.
- Gross margin percentage
- SG&A expense percentage
- Operating profit margin percentage
- Net profit margin (after taxes) percentage
- Inventory turnover
- Asset turnover
- Return on Assets (ROA) percentage
- Compare and contrast the calculated financial figures for Tiffany and TJX. Analyze and discuss why the percentages and ratios differ for the two retailers.
- Analyze which retailer has the better overall financial performance.
- Why is ROA a good measure of a retailers financial performance?
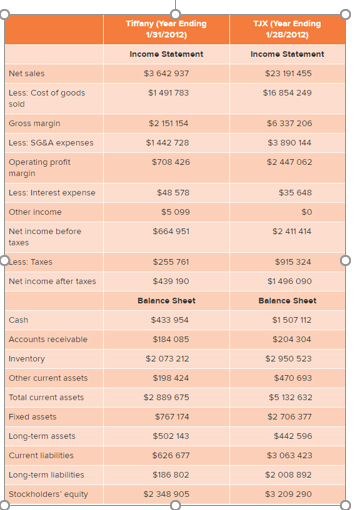
Tiffany (Year Ending 1/31/2012) TJX (Year Ending 1/28/2012) Income Statement Income Statement Net sales $23 191 455 $3 642 937 $1491783 $16 854 249 Less: Cost of goods sold Gross margin $6 337 206 $2 151 154 $1442 728 $708 426 $3 890 144 $2 447 062 Less: SG&A expenses Operating profit margin Less: Interest expense $35 648 $48 578 $5 099 SO Other income Net income before taxes $664 951 $2 411 414 Dess: Taxes $915 324 $255 761 $439 190 Net income after taxes $1 496 090 Balance Sheet Cash $433 954 Balance Sheet S1507112 $204 304 Accounts receivable $184 085 $2073 212 $2 950 523 Inventory Other current assets Total current assets $198 424 $470 693 $2 889 675 $5 132 632 Fixed assets $767 174 $2 706 377 Long-term assets $502 143 $442 596 Current liabilities $626 677 $3 063 423 Long-term liabilities $186 802 $2 008 892 Stockholders' equity $2 348 905 $3 209 290
Step by Step Solution
There are 3 Steps involved in it
1 Expert Approved Answer
Step: 1 Unlock

Question Has Been Solved by an Expert!
Get step-by-step solutions from verified subject matter experts
Step: 2 Unlock
Step: 3 Unlock