

Question: Case 3 - - Improving Service Time at ( Deters Burgers DISCUSSION QUESTIONS 1 . Construct x - bar and R control charts to monitor
Case Improving Service Time at Deters Burgers
DISCUSSION QUESTIONS
Construct xbar and R control charts to monitor the service at the drivethrough window.
Must show:
a The UCLLCL limits for both charts result from your analysis.
UCLx LCLx
UCLR LCLR
b Plot the control charts and label the UCL, central line, and LCL on both charts.
Failure to do so receives no credit.
c Explain whether the process is in control or not. Did they manage to meet the expected service
time goal of minutes?
In a situation where the process is not under control, which TQM tool would you suggest to identify
the cause of the issue and improve customer service? Provide your rationale for your chosen tool.
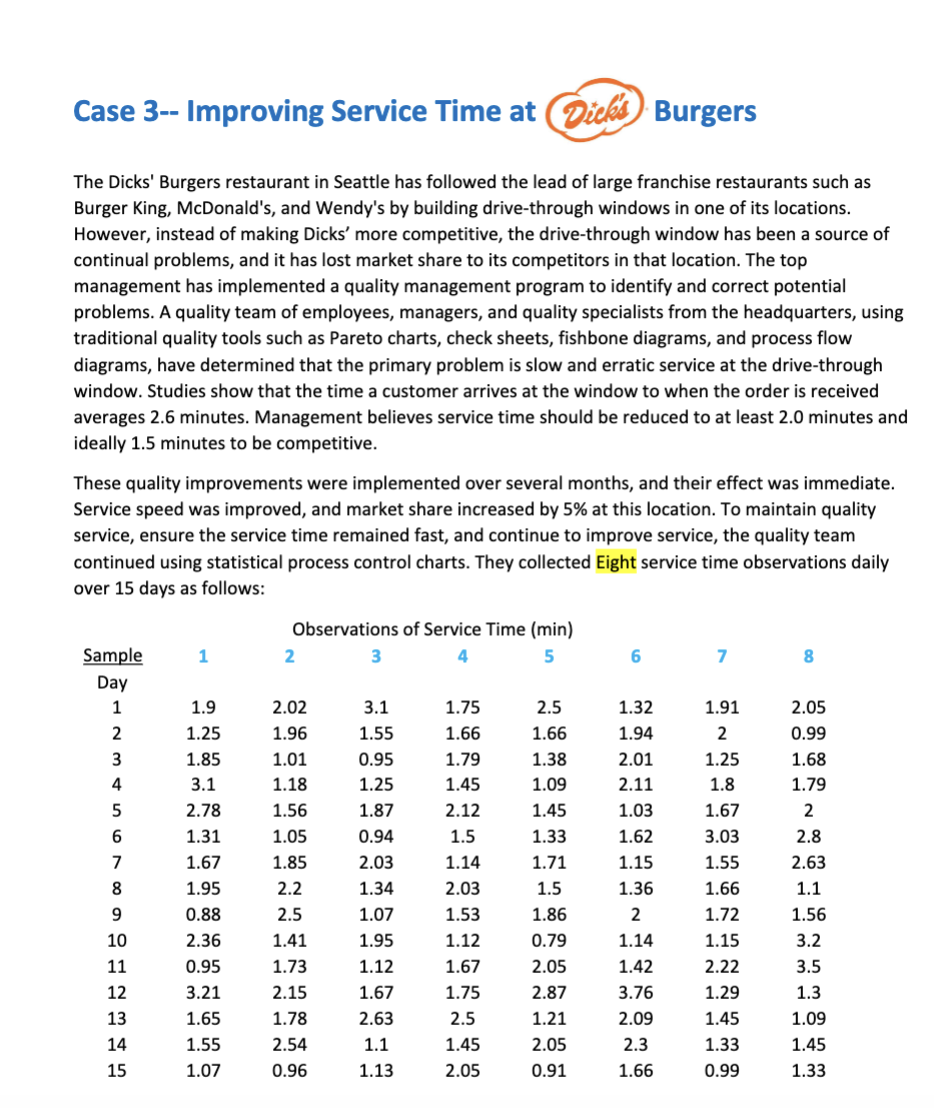
The Dicks' Burgers restaurant in Seattle has followed the lead of large franchise restaurants such as Burger King, McDonald's, and Wendy's by building drivethrough windows in one of its locations. However, instead of making Dicks' more competitive, the drivethrough window has been a source of continual problems, and it has lost market share to its competitors in that location. The top management has implemented a quality management program to identify and correct potential problems. A quality team of employees, managers, and quality specialists from the headquarters, using traditional quality tools such as Pareto charts, check sheets, fishbone diagrams, and process flow diagrams, have determined that the primary problem is slow and erratic service at the drivethrough window. Studies show that the time a customer arrives at the window to when the order is received averages minutes. Management believes service time should be reduced to at least minutes and ideally minutes to be competitive.
These quality improvements were implemented over several months, and their effect was immediate. Service speed was improved, and market share increased by at this location. To maintain quality service, ensure the service time remained fast, and continue to improve service, the quality team continued using statistical process control charts. They collected Eight service time observations daily over days as follows:
Step by Step Solution
There are 3 Steps involved in it
1 Expert Approved Answer
Step: 1 Unlock

Question Has Been Solved by an Expert!
Get step-by-step solutions from verified subject matter experts
Step: 2 Unlock
Step: 3 Unlock